

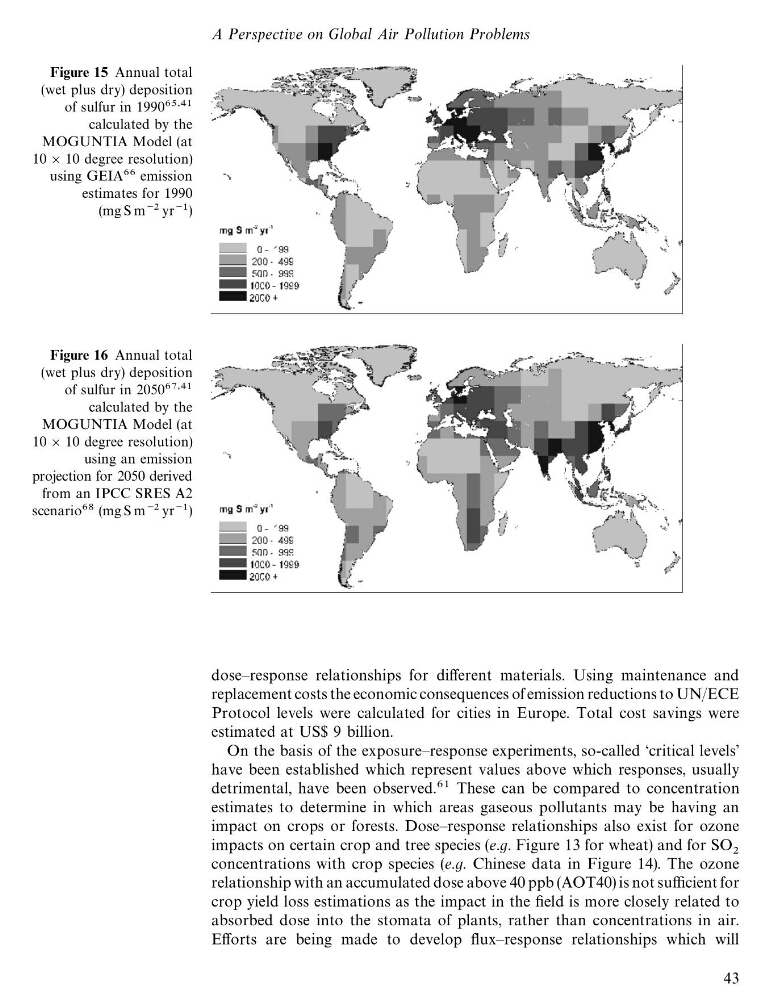
Figure 15 Annual total
(wet plus dry) deposition
of sulfur in 1990
calculated by the
MOGUNTIA Model (at
10 ; 10 degree resolution)
using GEIA emission
estimates for 1990
(mg S m\ yr\)
Figure 16 Annual total
(wet plus dry) deposition
of sulfur in 2050
calculated by the
MOGUNTIA Model (at
10 ; 10 degree resolution)
using an emission
projection for 2050 derived
from an IPCC SRES A2
scenario (mg S m\ yr\)
dose—response relationships for different materials. Using maintenance and
replacement costs the economic consequences of emission reductions to UN/ECE
Protocol levels were calculated for cities in Europe. Total cost savings were
estimated at US$ 9 billion.
On the basis of the exposure—response experiments, so-called ‘critical levels’
have been established which represent values above which responses, usually
detrimental, have been observed. These can be compared to concentration
estimates to determine in which areas gaseous pollutants may be having an
impact on crops or forests. Dose—response relationships also exist for ozone
impacts on certain crop and tree species (e.g. Figure 13 for wheat) and for SO
concentrations with crop species (e.g. Chinese data in Figure 14). The ozone
relationship with an accumulated dose above 40 ppb (AOT40) is not sufficient for
crop yield loss estimations as the impact in the field is more closely related to
absorbed dose into the stomata of plants, rather than concentrations in air.
Efforts are being made to develop flux—response relationships which will
A Perspective on Global Air Pollution Problems
43
(wet plus dry) deposition
of sulfur in 1990
calculated by the
MOGUNTIA Model (at
10 ; 10 degree resolution)
using GEIA emission
estimates for 1990
(mg S m\ yr\)
Figure 16 Annual total
(wet plus dry) deposition
of sulfur in 2050
calculated by the
MOGUNTIA Model (at
10 ; 10 degree resolution)
using an emission
projection for 2050 derived
from an IPCC SRES A2
scenario (mg S m\ yr\)
dose—response relationships for different materials. Using maintenance and
replacement costs the economic consequences of emission reductions to UN/ECE
Protocol levels were calculated for cities in Europe. Total cost savings were
estimated at US$ 9 billion.
On the basis of the exposure—response experiments, so-called ‘critical levels’
have been established which represent values above which responses, usually
detrimental, have been observed. These can be compared to concentration
estimates to determine in which areas gaseous pollutants may be having an
impact on crops or forests. Dose—response relationships also exist for ozone
impacts on certain crop and tree species (e.g. Figure 13 for wheat) and for SO
concentrations with crop species (e.g. Chinese data in Figure 14). The ozone
relationship with an accumulated dose above 40 ppb (AOT40) is not sufficient for
crop yield loss estimations as the impact in the field is more closely related to
absorbed dose into the stomata of plants, rather than concentrations in air.
Efforts are being made to develop flux—response relationships which will
A Perspective on Global Air Pollution Problems
43