

0
1
2
3
4
5
6
7
8
9
OECD
Pacific
China+
S&SE
Asia
Africa
Latin
America
Middle
East
North
America
Europe
NOx emissions (Tg N yr
-1
) - technology convergence
1995
2025
2010 (Europe only)
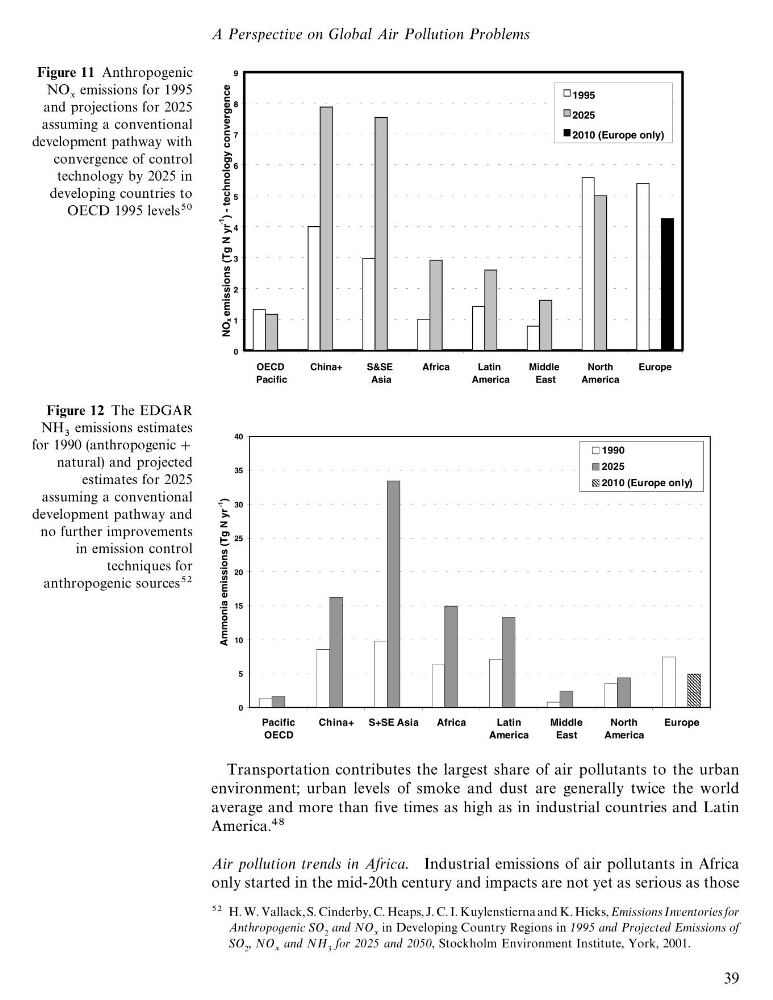
Figure 11 Anthropogenic
NO
V
emissions for 1995
and projections for 2025
assuming a conventional
development pathway with
convergence of control
technology by 2025 in
developing countries to
OECD 1995 levels
0
5
10
15
20
25
30
35
40
Pacific
OECD
China+ S+SE Asia
Africa
Latin
America
Middle
East
North
America
Europe
Ammonia emissions (Tg N yr
-1
)
1990
2025
2010 (Europe only)
Figure 12 The EDGAR
NH
emissions estimates
for 1990 (anthropogenic ;
natural) and projected
estimates for 2025
assuming a conventional
development pathway and
no further improvements
in emission control
techniques for
anthropogenic sources
Transportation contributes the largest share of air pollutants to the urban
environment; urban levels of smoke and dust are generally twice the world
average and more than five times as high as in industrial countries and Latin
America.
Air pollution trends in Africa. Industrial emissions of air pollutants in Africa
only started in the mid-20th century and impacts are not yet as serious as those
H. W. Vallack, S. Cinderby, C. Heaps, J. C. I. Kuylenstierna and K. Hicks, Emissions Inventories for
Anthropogenic SO 2 and NO V
in Developing Country Regions in 1995 and Projected Emissions of
SO 2 , NO
V
and NH 3 for 2025 and 2050, Stockholm Environment Institute, York, 2001.
A Perspective on Global Air Pollution Problems
39
1
2
3
4
5
6
7
8
9
OECD
Pacific
China+
S&SE
Asia
Africa
Latin
America
Middle
East
North
America
Europe
NOx emissions (Tg N yr
-1
) - technology convergence
1995
2025
2010 (Europe only)
Figure 11 Anthropogenic
NO
V
emissions for 1995
and projections for 2025
assuming a conventional
development pathway with
convergence of control
technology by 2025 in
developing countries to
OECD 1995 levels
0
5
10
15
20
25
30
35
40
Pacific
OECD
China+ S+SE Asia
Africa
Latin
America
Middle
East
North
America
Europe
Ammonia emissions (Tg N yr
-1
)
1990
2025
2010 (Europe only)
Figure 12 The EDGAR
NH
emissions estimates
for 1990 (anthropogenic ;
natural) and projected
estimates for 2025
assuming a conventional
development pathway and
no further improvements
in emission control
techniques for
anthropogenic sources
Transportation contributes the largest share of air pollutants to the urban
environment; urban levels of smoke and dust are generally twice the world
average and more than five times as high as in industrial countries and Latin
America.
Air pollution trends in Africa. Industrial emissions of air pollutants in Africa
only started in the mid-20th century and impacts are not yet as serious as those
H. W. Vallack, S. Cinderby, C. Heaps, J. C. I. Kuylenstierna and K. Hicks, Emissions Inventories for
Anthropogenic SO 2 and NO V
in Developing Country Regions in 1995 and Projected Emissions of
SO 2 , NO
V
and NH 3 for 2025 and 2050, Stockholm Environment Institute, York, 2001.
A Perspective on Global Air Pollution Problems
39