

0
20
40
60
80
100
1980
1990
2000
2010
Year
Millions of tonnes of SO2
Asia
Europe
United States
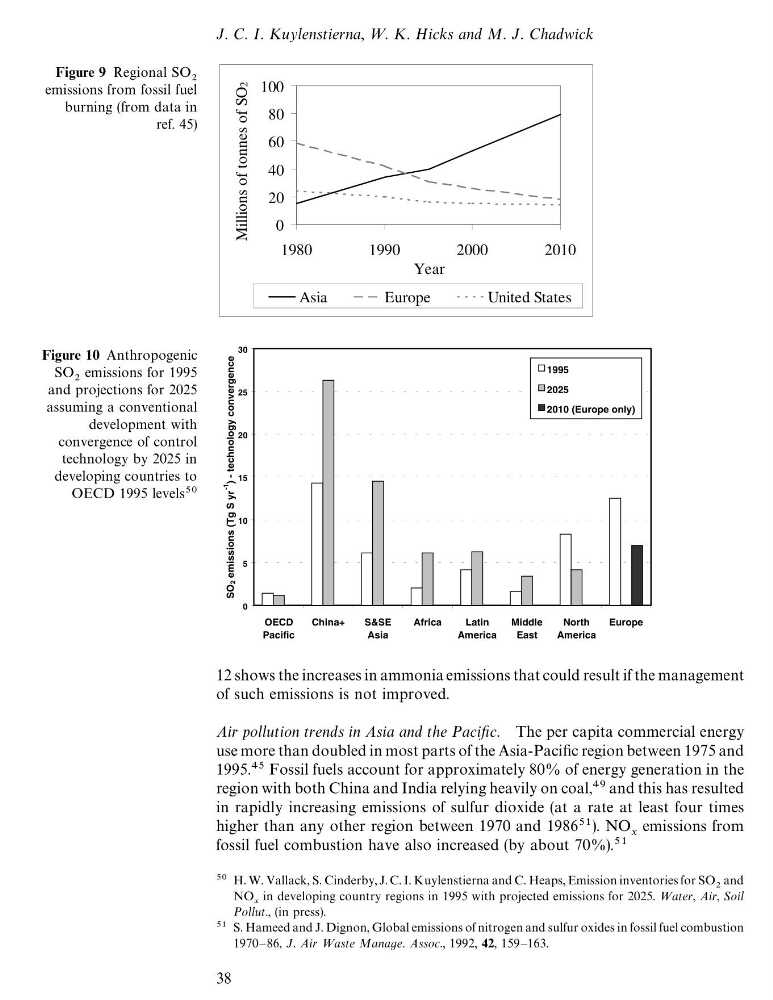
Figure 9 Regional SO
emissions from fossil fuel
burning (from data in
ref. 45)
0
5
10
15
20
25
30
OECD
Pacific
China+
S&SE
Asia
Africa
Latin
America
Middle
East
North
America
Europe
SO2 emissions (Tg S yr
-1
) - technology convergence
1995
2025
2010 (Europe only)
Figure 10 Anthropogenic
SO
emissions for 1995
and projections for 2025
assuming a conventional
development with
convergence of control
technology by 2025 in
developing countries to
OECD 1995 levels
12 shows the increases in ammonia emissions that could result if the management
of such emissions is not improved.
Air pollution trends in Asia and the Pacific. The per capita commercial energy
use more than doubled in most parts of the Asia-Pacific region between 1975 and
1995. Fossil fuels account for approximately 80% of energy generation in the
region with both China and India relying heavily on coal, and this has resulted
in rapidly increasing emissions of sulfur dioxide (at a rate at least four times
higher than any other region between 1970 and 1986). NO V
emissions from
fossil fuel combustion have also increased (by about 70%).
H. W. Vallack, S. Cinderby, J. C. I. Kuylenstierna and C. Heaps, Emission inventories for SO
and
NO
V
in developing country regions in 1995 with projected emissions for 2025. Water, Air, Soil
Pollut., (in press).
S. Hameed and J. Dignon, Global emissions of nitrogen and sulfur oxides in fossil fuel combustion
1970—86, J. Air Waste Manage. Assoc., 1992, 42, 159—163.
J. C. I. Kuylenstierna, W. K. Hicks and M. J. Chadwick
38
20
40
60
80
100
1980
1990
2000
2010
Year
Millions of tonnes of SO2
Asia
Europe
United States
Figure 9 Regional SO
emissions from fossil fuel
burning (from data in
ref. 45)
0
5
10
15
20
25
30
OECD
Pacific
China+
S&SE
Asia
Africa
Latin
America
Middle
East
North
America
Europe
SO2 emissions (Tg S yr
-1
) - technology convergence
1995
2025
2010 (Europe only)
Figure 10 Anthropogenic
SO
emissions for 1995
and projections for 2025
assuming a conventional
development with
convergence of control
technology by 2025 in
developing countries to
OECD 1995 levels
12 shows the increases in ammonia emissions that could result if the management
of such emissions is not improved.
Air pollution trends in Asia and the Pacific. The per capita commercial energy
use more than doubled in most parts of the Asia-Pacific region between 1975 and
1995. Fossil fuels account for approximately 80% of energy generation in the
region with both China and India relying heavily on coal, and this has resulted
in rapidly increasing emissions of sulfur dioxide (at a rate at least four times
higher than any other region between 1970 and 1986). NO V
emissions from
fossil fuel combustion have also increased (by about 70%).
H. W. Vallack, S. Cinderby, J. C. I. Kuylenstierna and C. Heaps, Emission inventories for SO
and
NO
V
in developing country regions in 1995 with projected emissions for 2025. Water, Air, Soil
Pollut., (in press).
S. Hameed and J. Dignon, Global emissions of nitrogen and sulfur oxides in fossil fuel combustion
1970—86, J. Air Waste Manage. Assoc., 1992, 42, 159—163.
J. C. I. Kuylenstierna, W. K. Hicks and M. J. Chadwick
38