

Asia
Greenland
Alaska
NP
A.
B.
1979-2000 median minimum
2009 minimum
5
6
5.5
4
4.5
7
6.5
8
7.5
9
8.5
1978
1983
1988
1993
Year
1998
2003
2008
2013
Year to year
changes
Extent (million sq. km)
Trend line
1979–2009
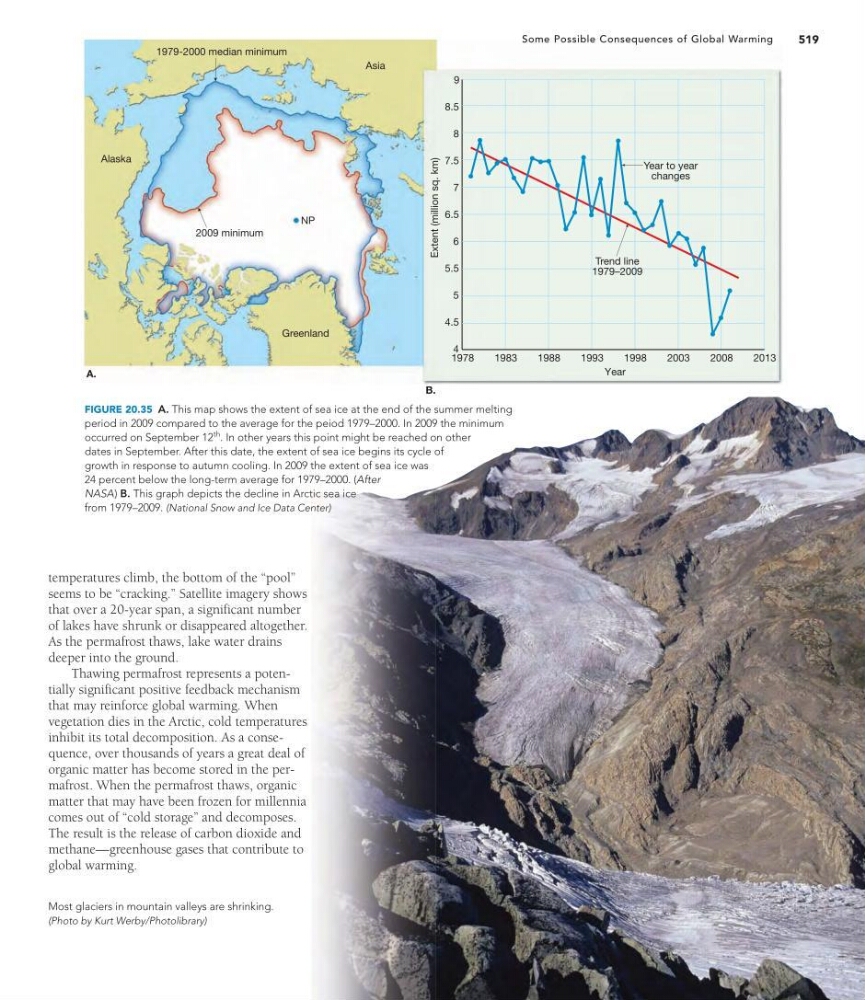
FIGURE 20.35 A. This map shows the extent of sea ice at the end of the summer melting
period in 2009 compared to the average for the peiod 1979–2000. In 2009 the minimum
occurred on September 12
th
. In other years this point might be reached on other
dates in September. After this date, the extent of sea ice begins its cycle of
growth in response to autumn cooling. In 2009 the extent of sea ice was
24 percent below the long-term average for 1979–2000. (After
NASA) B. This graph depicts the decline in Arctic sea ice
from 1979–2009. (National Snow and Ice Data Center)
519
Some Possible Consequences of Global Warming
Most glaciers in mountain valleys are shrinking.
(Photo by Kurt Werby/Photolibrary)
temperatures climb, the bottom of the “pool”
seems to be “cracking.” Satellite imagery shows
that over a 20-year span, a significant number
of lakes have shrunk or disappeared altogether.
As the permafrost thaws, lake water drains
deeper into the ground.
Thawing permafrost represents a potentially significant positive feedback mechanism
that may reinforce global warming. When
vegetation dies in the Arctic, cold temperatures
inhibit its total decomposition. As a consequence, over thousands of years a great deal of
organic matter has become stored in the permafrost. When the permafrost thaws, organic
matter that may have been frozen for millennia
comes out of “cold storage” and decomposes.
The result is the release of carbon dioxide and
methane—greenhouse gases that contribute to
global warming.
Greenland
Alaska
NP
A.
B.
1979-2000 median minimum
2009 minimum
5
6
5.5
4
4.5
7
6.5
8
7.5
9
8.5
1978
1983
1988
1993
Year
1998
2003
2008
2013
Year to year
changes
Extent (million sq. km)
Trend line
1979–2009
FIGURE 20.35 A. This map shows the extent of sea ice at the end of the summer melting
period in 2009 compared to the average for the peiod 1979–2000. In 2009 the minimum
occurred on September 12
th
. In other years this point might be reached on other
dates in September. After this date, the extent of sea ice begins its cycle of
growth in response to autumn cooling. In 2009 the extent of sea ice was
24 percent below the long-term average for 1979–2000. (After
NASA) B. This graph depicts the decline in Arctic sea ice
from 1979–2009. (National Snow and Ice Data Center)
519
Some Possible Consequences of Global Warming
Most glaciers in mountain valleys are shrinking.
(Photo by Kurt Werby/Photolibrary)
temperatures climb, the bottom of the “pool”
seems to be “cracking.” Satellite imagery shows
that over a 20-year span, a significant number
of lakes have shrunk or disappeared altogether.
As the permafrost thaws, lake water drains
deeper into the ground.
Thawing permafrost represents a potentially significant positive feedback mechanism
that may reinforce global warming. When
vegetation dies in the Arctic, cold temperatures
inhibit its total decomposition. As a consequence, over thousands of years a great deal of
organic matter has become stored in the permafrost. When the permafrost thaws, organic
matter that may have been frozen for millennia
comes out of “cold storage” and decomposes.
The result is the release of carbon dioxide and
methane—greenhouse gases that contribute to
global warming.