

511
Carbon Dioxide, Trace Gases, and Climate Change
*IPCC, Summary for Policy Makers. In Climate
Change 2007: The Physical Science Basis. p. 4.
Cambridge University Press, Cambridge, United
Kingdom and New York, NY.
D I D Y O U K N O W ?
The IPCC referred to in the discussion
of global warming was established by
the United Nations and the World
Meteorological Organization in 1988 to
access the scientific, technical, and
socioeconomic information that is
relevant to understanding humancaused climate change. It is an
authoritative group that provides
periodic reports regarding the state of
knowledge about causes and effects of
climate change. More than 1250
authors and 2500 scientific reviewers
from more than 130 countries
contributed to the IPCC’s most recent
report, Climate Change 2007. The
Fourth Assessment Report.
record of changes in atmospheric CO 2 extending back
400,000 years. Over this
long span, natural fluctuations varied from about 180
to 300 parts per million
(ppm). As a result of human
activities, the present CO 2
level is about 30 percent
higher than its highest level
over at least the last
650,000 years. The rapid
increase in CO 2 concentrations since the onset of
industrialization is obvious.
The annual rate at which
atmospheric CO 2
concentrations are growing
has been increasing over the
last several decades (FIGURE
20.24).
The Atmosphere’ s
Response
Given the increase in the
atmosphere’ s carbon dioxide
content, have global
temperatures actually increased? The
answer is yes. According to a 2007 report
by the Intergovernmental Panel on
Climate Change (IPCC), “Warming of the
climate system is unequivocal, as is now
evident from observations of increases in
global average air and ocean temperatures,
widespread melting of snow and ice, and
Annual CO2 Contribution of an
Average American
17,000 pounds
of CO2 by using
1,100 kilowatt-hours
of electricity
per month
1,000 pounds
of CO2 by creating
4.5 pounds
of trash
per day
8,900 pounds
of CO2 by
driving
160 miles
per week
1,000 pounds
of CO2 by
flying
1,900 miles
per year
8,800 pounds
of CO2 by using
6,300 cubic feet
of natural gas
per month
FIGURE 20.24 Americans are responsible for
about 25 percent of the world’s greenhouse-gas
emissions. That amounts to 24,300 kilograms
(54,000 pounds) of carbon dioxide each year for
an average American, which is about five times
the emissions of the average global citizen. This
diagram represents some of the ways that people
in the United States contribute. (Data from various
U.S. government agencies; Photo by Jerry
Schad/Photo Researchers, Inc.)
rising global sea level.”* It is very likely
that most of the observed increase in
global average temperatures since the mid20th century is due to the observed
increase in human-generated greenhousegas concentrations. (As used by the IPCC,
very likely indicates a probability of 90 to
99 percent.) Global warming since the mid1970s is now about 0.6 °C (1 °F), and total
warming in the past century is about 0.8 °C
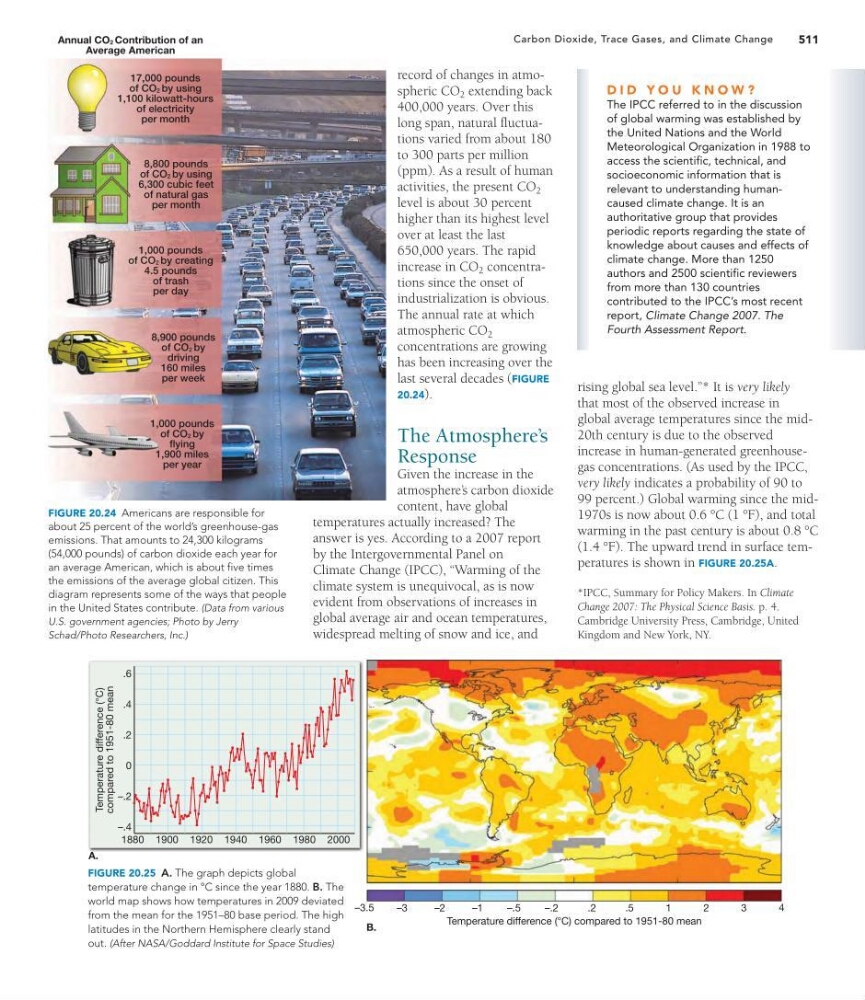
(1.4 °F). The upward trend in surface temperatures is shown in FIGURE 20.25A.
Temperature difference (°C) compared to 1951-80 mean
Temperature difference (°C)
compared to 1951-80 mean
A.
B.
–3.5
1880 1900 1920 1940 1960 1980 2000
–3
–2
–1
–.5
1
2
3
4
–.2
.2
.6
.4
.2
0
–.2
–.4
.5
FIGURE 20.25 A. The graph depicts global
temperature change in °C since the year 1880. B. The
world map shows how temperatures in 2009 deviated
from the mean for the 1951–80 base period. The high
latitudes in the Northern Hemisphere clearly stand
out. (After NASA/Goddard Institute for Space Studies)
Carbon Dioxide, Trace Gases, and Climate Change
*IPCC, Summary for Policy Makers. In Climate
Change 2007: The Physical Science Basis. p. 4.
Cambridge University Press, Cambridge, United
Kingdom and New York, NY.
D I D Y O U K N O W ?
The IPCC referred to in the discussion
of global warming was established by
the United Nations and the World
Meteorological Organization in 1988 to
access the scientific, technical, and
socioeconomic information that is
relevant to understanding humancaused climate change. It is an
authoritative group that provides
periodic reports regarding the state of
knowledge about causes and effects of
climate change. More than 1250
authors and 2500 scientific reviewers
from more than 130 countries
contributed to the IPCC’s most recent
report, Climate Change 2007. The
Fourth Assessment Report.
record of changes in atmospheric CO 2 extending back
400,000 years. Over this
long span, natural fluctuations varied from about 180
to 300 parts per million
(ppm). As a result of human
activities, the present CO 2
level is about 30 percent
higher than its highest level
over at least the last
650,000 years. The rapid
increase in CO 2 concentrations since the onset of
industrialization is obvious.
The annual rate at which
atmospheric CO 2
concentrations are growing
has been increasing over the
last several decades (FIGURE
20.24).
The Atmosphere’ s
Response
Given the increase in the
atmosphere’ s carbon dioxide
content, have global
temperatures actually increased? The
answer is yes. According to a 2007 report
by the Intergovernmental Panel on
Climate Change (IPCC), “Warming of the
climate system is unequivocal, as is now
evident from observations of increases in
global average air and ocean temperatures,
widespread melting of snow and ice, and
Annual CO2 Contribution of an
Average American
17,000 pounds
of CO2 by using
1,100 kilowatt-hours
of electricity
per month
1,000 pounds
of CO2 by creating
4.5 pounds
of trash
per day
8,900 pounds
of CO2 by
driving
160 miles
per week
1,000 pounds
of CO2 by
flying
1,900 miles
per year
8,800 pounds
of CO2 by using
6,300 cubic feet
of natural gas
per month
FIGURE 20.24 Americans are responsible for
about 25 percent of the world’s greenhouse-gas
emissions. That amounts to 24,300 kilograms
(54,000 pounds) of carbon dioxide each year for
an average American, which is about five times
the emissions of the average global citizen. This
diagram represents some of the ways that people
in the United States contribute. (Data from various
U.S. government agencies; Photo by Jerry
Schad/Photo Researchers, Inc.)
rising global sea level.”* It is very likely
that most of the observed increase in
global average temperatures since the mid20th century is due to the observed
increase in human-generated greenhousegas concentrations. (As used by the IPCC,
very likely indicates a probability of 90 to
99 percent.) Global warming since the mid1970s is now about 0.6 °C (1 °F), and total
warming in the past century is about 0.8 °C
(1.4 °F). The upward trend in surface temperatures is shown in FIGURE 20.25A.
Temperature difference (°C) compared to 1951-80 mean
Temperature difference (°C)
compared to 1951-80 mean
A.
B.
–3.5
1880 1900 1920 1940 1960 1980 2000
–3
–2
–1
–.5
1
2
3
4
–.2
.2
.6
.4
.2
0
–.2
–.4
.5
FIGURE 20.25 A. The graph depicts global
temperature change in °C since the year 1880. B. The
world map shows how temperatures in 2009 deviated
from the mean for the 1951–80 base period. The high
latitudes in the Northern Hemisphere clearly stand
out. (After NASA/Goddard Institute for Space Studies)