

CHAPTER 20 Global Climate Change
510
400,000
2010
1950
460
440
420
400
380
360
340
320
300
280
260
240
220
200
180
160
For 650,000 years, atmospheric CO2
CO2 parts per million
Years before today
350,000 300,000 250,000 200,000 150,000 100,000 50,000
0
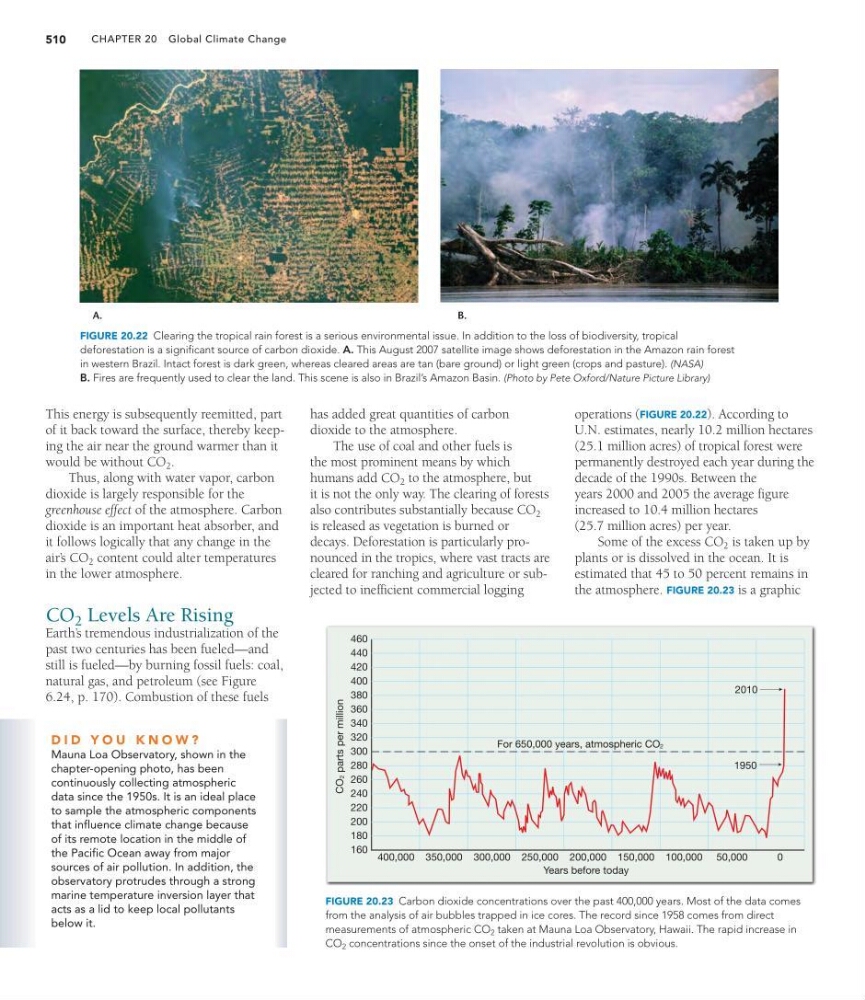
FIGURE 20.23 Carbon dioxide concentrations over the past 400,000 years. Most of the data comes
from the analysis of air bubbles trapped in ice cores. The record since 1958 comes from direct
measurements of atmospheric CO 2 taken at Mauna Loa Observatory, Hawaii. The rapid increase in
CO 2 concentrations since the onset of the industrial revolution is obvious.
This energy is subsequently reemitted, part
of it back toward the surface, thereby keeping the air near the ground warmer than it
would be without CO 2 .
Thus, along with water vapor, carbon
dioxide is largely responsible for the
greenhouse effect of the atmosphere. Carbon
dioxide is an important heat absorber, and
it follows logically that any change in the
air’ s CO 2 content could alter temperatures
in the lower atmosphere.
CO 2 Levels Are Rising
Earth’ s tremendous industrialization of the
past two centuries has been fueled—and
still is fueled—by burning fossil fuels: coal,
natural gas, and petroleum (see Figure
6.24, p. 170). Combustion of these fuels
has added great quantities of carbon
dioxide to the atmosphere.
The use of coal and other fuels is
the most prominent means by which
humans add CO 2 to the atmosphere, but
it is not the only way. The clearing of forests
also contributes substantially because CO 2
is released as vegetation is burned or
decays. Deforestation is particularly pronounced in the tropics, where vast tracts are
cleared for ranching and agriculture or subjected to inefficient commercial logging
operations (FIGURE 20.22). According to
U.N. estimates, nearly 10.2 million hectares
(25.1 million acres) of tropical forest were
permanently destroyed each year during the
decade of the 1990s. Between the
years 2000 and 2005 the average figure
increased to 10.4 million hectares
(25.7 million acres) per year.
Some of the excess CO 2 is taken up by
plants or is dissolved in the ocean. It is
estimated that 45 to 50 percent remains in
the atmosphere. FIGURE 20.23 is a graphic
A.
B.
FIGURE 20.22 Clearing the tropical rain forest is a serious environmental issue. In addition to the loss of biodiversity, tropical
deforestation is a significant source of carbon dioxide. A. This August 2007 satellite image shows deforestation in the Amazon rain forest
in western Brazil. Intact forest is dark green, whereas cleared areas are tan (bare ground) or light green (crops and pasture). (NASA)
B. Fires are frequently used to clear the land. This scene is also in Brazil’s Amazon Basin. (Photo by Pete Oxford/Nature Picture Library)
D I D Y O U K N O W ?
Mauna Loa Observatory, shown in the
chapter-opening photo, has been
continuously collecting atmospheric
data since the 1950s. It is an ideal place
to sample the atmospheric components
that influence climate change because
of its remote location in the middle of
the Pacific Ocean away from major
sources of air pollution. In addition, the
observatory protrudes through a strong
marine temperature inversion layer that
acts as a lid to keep local pollutants
below it.
510
400,000
2010
1950
460
440
420
400
380
360
340
320
300
280
260
240
220
200
180
160
For 650,000 years, atmospheric CO2
CO2 parts per million
Years before today
350,000 300,000 250,000 200,000 150,000 100,000 50,000
0
FIGURE 20.23 Carbon dioxide concentrations over the past 400,000 years. Most of the data comes
from the analysis of air bubbles trapped in ice cores. The record since 1958 comes from direct
measurements of atmospheric CO 2 taken at Mauna Loa Observatory, Hawaii. The rapid increase in
CO 2 concentrations since the onset of the industrial revolution is obvious.
This energy is subsequently reemitted, part
of it back toward the surface, thereby keeping the air near the ground warmer than it
would be without CO 2 .
Thus, along with water vapor, carbon
dioxide is largely responsible for the
greenhouse effect of the atmosphere. Carbon
dioxide is an important heat absorber, and
it follows logically that any change in the
air’ s CO 2 content could alter temperatures
in the lower atmosphere.
CO 2 Levels Are Rising
Earth’ s tremendous industrialization of the
past two centuries has been fueled—and
still is fueled—by burning fossil fuels: coal,
natural gas, and petroleum (see Figure
6.24, p. 170). Combustion of these fuels
has added great quantities of carbon
dioxide to the atmosphere.
The use of coal and other fuels is
the most prominent means by which
humans add CO 2 to the atmosphere, but
it is not the only way. The clearing of forests
also contributes substantially because CO 2
is released as vegetation is burned or
decays. Deforestation is particularly pronounced in the tropics, where vast tracts are
cleared for ranching and agriculture or subjected to inefficient commercial logging
operations (FIGURE 20.22). According to
U.N. estimates, nearly 10.2 million hectares
(25.1 million acres) of tropical forest were
permanently destroyed each year during the
decade of the 1990s. Between the
years 2000 and 2005 the average figure
increased to 10.4 million hectares
(25.7 million acres) per year.
Some of the excess CO 2 is taken up by
plants or is dissolved in the ocean. It is
estimated that 45 to 50 percent remains in
the atmosphere. FIGURE 20.23 is a graphic
A.
B.
FIGURE 20.22 Clearing the tropical rain forest is a serious environmental issue. In addition to the loss of biodiversity, tropical
deforestation is a significant source of carbon dioxide. A. This August 2007 satellite image shows deforestation in the Amazon rain forest
in western Brazil. Intact forest is dark green, whereas cleared areas are tan (bare ground) or light green (crops and pasture). (NASA)
B. Fires are frequently used to clear the land. This scene is also in Brazil’s Amazon Basin. (Photo by Pete Oxford/Nature Picture Library)
D I D Y O U K N O W ?
Mauna Loa Observatory, shown in the
chapter-opening photo, has been
continuously collecting atmospheric
data since the 1950s. It is an ideal place
to sample the atmospheric components
that influence climate change because
of its remote location in the middle of
the Pacific Ocean away from major
sources of air pollution. In addition, the
observatory protrudes through a strong
marine temperature inversion layer that
acts as a lid to keep local pollutants
below it.