

CHAPTER 20 Global Climate Change
498
Scientists collect samples with a
drilling rig, like a small version of an oil
drill. A hollow shaft follows the drill
head into the ice, and an ice core is
extracted. In this way, cores that sometimes
exceed 2000 meters (6500 feet) in length,
and may represent more than 200,000
years of climate history, are acquired for
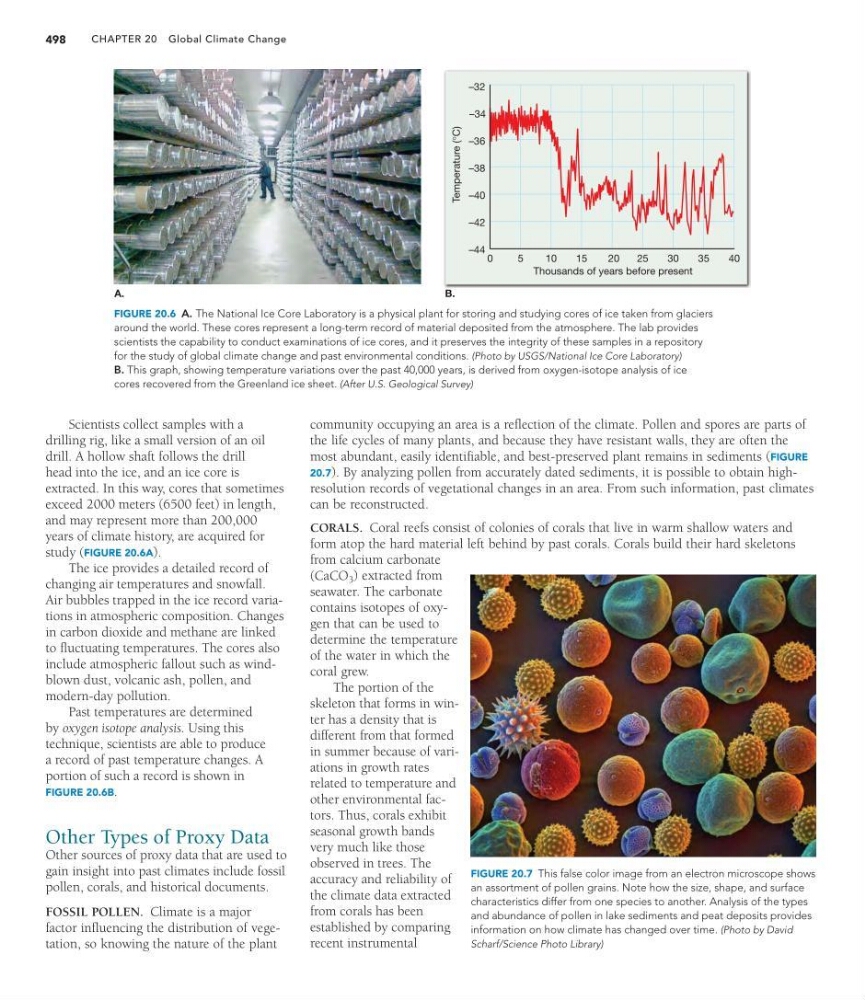
study (FIGURE 20.6A).
The ice provides a detailed record of
changing air temperatures and snowfall.
Air bubbles trapped in the ice record variations in atmospheric composition. Changes
in carbon dioxide and methane are linked
to fluctuating temperatures. The cores also
include atmospheric fallout such as windblown dust, volcanic ash, pollen, and
modern-day pollution.
Past temperatures are determined
by oxygen isotope analysis. Using this
technique, scientists are able to produce
a record of past temperature changes. A
portion of such a record is shown in
FIGURE 20.6B.
Other Types of Proxy Data
Other sources of proxy data that are used to
gain insight into past climates include fossil
pollen, corals, and historical documents.
FOSSIL POLLEN. Climate is a major
factor influencing the distribution of vegetation, so knowing the nature of the plant
community occupying an area is a reflection of the climate. Pollen and spores are parts of
the life cycles of many plants, and because they have resistant walls, they are often the
most abundant, easily identifiable, and best-preserved plant remains in sediments (FIGURE
20.7). By analyzing pollen from accurately dated sediments, it is possible to obtain highresolution records of vegetational changes in an area. From such information, past climates
can be reconstructed.
CORALS. Coral reefs consist of colonies of corals that live in warm shallow waters and
form atop the hard material left behind by past corals. Corals build their hard skeletons
from calcium carbonate
(CaCO 3 ) extracted from
seawater. The carbonate
contains isotopes of oxygen that can be used to
determine the temperature
of the water in which the
coral grew.
The portion of the
skeleton that forms in winter has a density that is
different from that formed
in summer because of variations in growth rates
related to temperature and
other environmental factors. Thus, corals exhibit
seasonal growth bands
very much like those
observed in trees. The
accuracy and reliability of
the climate data extracted
from corals has been
established by comparing
recent instrumental
0
5
1 0
B.
A.
15
20
25
30
35
40
Temperature (°C)
–44
–32
–34
–36
–38
–40
–42
Thousands of years before present
FIGURE 20.6 A. The National Ice Core Laboratory is a physical plant for storing and studying cores of ice taken from glaciers
around the world. These cores represent a long-term record of material deposited from the atmosphere. The lab provides
scientists the capability to conduct examinations of ice cores, and it preserves the integrity of these samples in a repository
for the study of global climate change and past environmental conditions. (Photo by USGS/National Ice Core Laboratory)
B. This graph, showing temperature variations over the past 40,000 years, is derived from oxygen-isotope analysis of ice
cores recovered from the Greenland ice sheet. (After U.S. Geological Survey)
FIGURE 20.7 This false color image from an electron microscope shows
an assortment of pollen grains. Note how the size, shape, and surface
characteristics differ from one species to another. Analysis of the types
and abundance of pollen in lake sediments and peat deposits provides
information on how climate has changed over time. (Photo by David
Scharf/Science Photo Library)
498
Scientists collect samples with a
drilling rig, like a small version of an oil
drill. A hollow shaft follows the drill
head into the ice, and an ice core is
extracted. In this way, cores that sometimes
exceed 2000 meters (6500 feet) in length,
and may represent more than 200,000
years of climate history, are acquired for
study (FIGURE 20.6A).
The ice provides a detailed record of
changing air temperatures and snowfall.
Air bubbles trapped in the ice record variations in atmospheric composition. Changes
in carbon dioxide and methane are linked
to fluctuating temperatures. The cores also
include atmospheric fallout such as windblown dust, volcanic ash, pollen, and
modern-day pollution.
Past temperatures are determined
by oxygen isotope analysis. Using this
technique, scientists are able to produce
a record of past temperature changes. A
portion of such a record is shown in
FIGURE 20.6B.
Other Types of Proxy Data
Other sources of proxy data that are used to
gain insight into past climates include fossil
pollen, corals, and historical documents.
FOSSIL POLLEN. Climate is a major
factor influencing the distribution of vegetation, so knowing the nature of the plant
community occupying an area is a reflection of the climate. Pollen and spores are parts of
the life cycles of many plants, and because they have resistant walls, they are often the
most abundant, easily identifiable, and best-preserved plant remains in sediments (FIGURE
20.7). By analyzing pollen from accurately dated sediments, it is possible to obtain highresolution records of vegetational changes in an area. From such information, past climates
can be reconstructed.
CORALS. Coral reefs consist of colonies of corals that live in warm shallow waters and
form atop the hard material left behind by past corals. Corals build their hard skeletons
from calcium carbonate
(CaCO 3 ) extracted from
seawater. The carbonate
contains isotopes of oxygen that can be used to
determine the temperature
of the water in which the
coral grew.
The portion of the
skeleton that forms in winter has a density that is
different from that formed
in summer because of variations in growth rates
related to temperature and
other environmental factors. Thus, corals exhibit
seasonal growth bands
very much like those
observed in trees. The
accuracy and reliability of
the climate data extracted
from corals has been
established by comparing
recent instrumental
0
5
1 0
B.
A.
15
20
25
30
35
40
Temperature (°C)
–44
–32
–34
–36
–38
–40
–42
Thousands of years before present
FIGURE 20.6 A. The National Ice Core Laboratory is a physical plant for storing and studying cores of ice taken from glaciers
around the world. These cores represent a long-term record of material deposited from the atmosphere. The lab provides
scientists the capability to conduct examinations of ice cores, and it preserves the integrity of these samples in a repository
for the study of global climate change and past environmental conditions. (Photo by USGS/National Ice Core Laboratory)
B. This graph, showing temperature variations over the past 40,000 years, is derived from oxygen-isotope analysis of ice
cores recovered from the Greenland ice sheet. (After U.S. Geological Survey)
FIGURE 20.7 This false color image from an electron microscope shows
an assortment of pollen grains. Note how the size, shape, and surface
characteristics differ from one species to another. Analysis of the types
and abundance of pollen in lake sediments and peat deposits provides
information on how climate has changed over time. (Photo by David
Scharf/Science Photo Library)