

343
Measuring the Size of Earthquakes
Now we know the distance, but what about direction? The
epicenter could be in any direction from the seismic station. Using
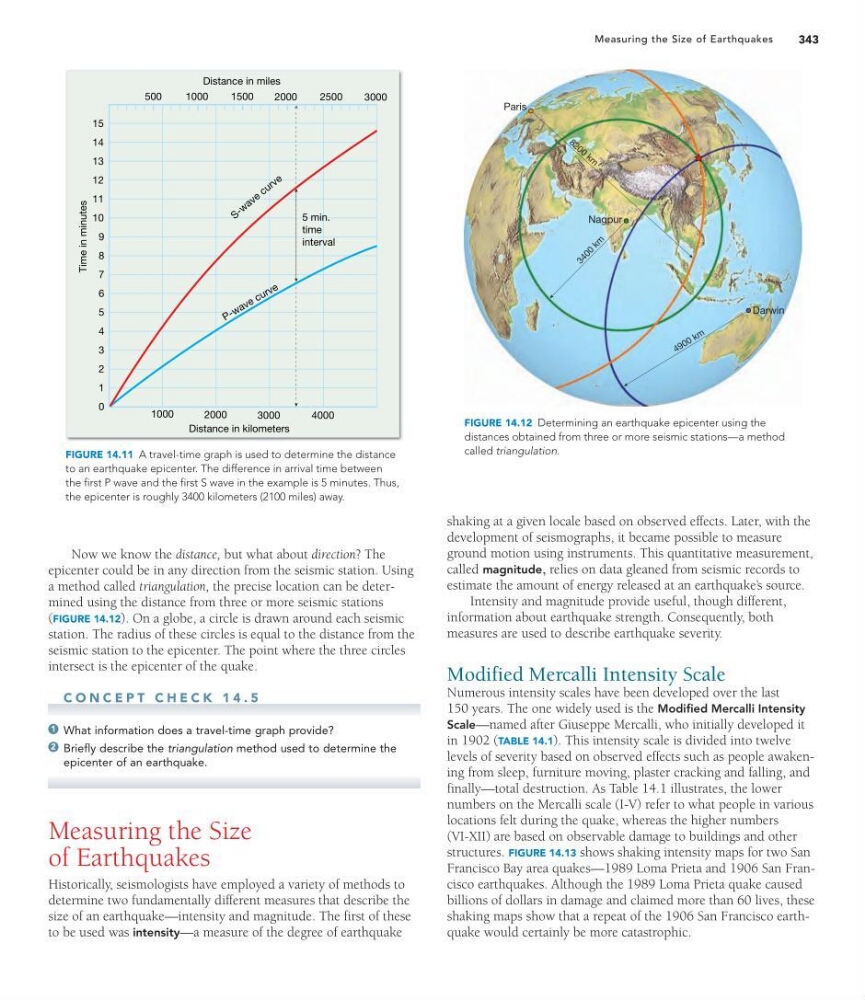
a method called triangulation, the precise location can be determined using the distance from three or more seismic stations
(FIGURE 14.12). On a globe, a circle is drawn around each seismic
station. The radius of these circles is equal to the distance from the
seismic station to the epicenter. The point where the three circles
intersect is the epicenter of the quake.
C O N C E P T C H E C K 1 4 . 5
What information does a travel-time graph provide?
Briefly describe the triangulation method used to determine the
epicenter of an earthquake.
Measuring the Size
of Earthquakes
Historically, seismologists have employed a variety of methods to
determine two fundamentally different measures that describe the
size of an earthquake—intensity and magnitude. The first of these
to be used was intensity—a measure of the degree of earthquake
2
1
shaking at a given locale based on observed effects. Later, with the
development of seismographs, it became possible to measure
ground motion using instruments. This quantitative measurement,
called magnitude, relies on data gleaned from seismic records to
estimate the amount of energy released at an earthquake’ s source.
Intensity and magnitude provide useful, though different,
information about earthquake strength. Consequently, both
measures are used to describe earthquake severity.
Modified Mercalli Intensity Scale
Numerous intensity scales have been developed over the last
150 years. The one widely used is the Modified Mercalli Intensity
Scale—named after Giuseppe Mercalli, who initially developed it
in 1902 (TABLE 14.1). This intensity scale is divided into twelve
levels of severity based on observed effects such as people awakening from sleep, furniture moving, plaster cracking and falling, and
finally—total destruction. As Table 14.1 illustrates, the lower
numbers on the Mercalli scale (I-V) refer to what people in various
locations felt during the quake, whereas the higher numbers
(VI-XII) are based on observable damage to buildings and other
structures. FIGURE 14.13 shows shaking intensity maps for two San
Francisco Bay area quakes—1989 Loma Prieta and 1906 San Francisco earthquakes. Although the 1989 Loma Prieta quake caused
billions of dollars in damage and claimed more than 60 lives, these
shaking maps show that a repeat of the 1906 San Francisco earthquake would certainly be more catastrophic.
P - w a v e c u r v e
S - w a v e
c u r v e
Time in minutes
15
14
13
12
11
10
9
8
7
6
5
4
3
2
1
0
1000
2000
3000
Distance in kilometers
5 min.
time
interval
1000
2000
3000
4000
Distance in miles
500
1500
2500
FIGURE 14.11 A travel-time graph is used to determine the distance
to an earthquake epicenter. The difference in arrival time between
the first P wave and the first S wave in the example is 5 minutes. Thus,
the epicenter is roughly 3400 kilometers (2100 miles) away.
3 4 0 0
k m
8 2 0 0 k m
4 9 0 0 k m
Nagpur
Darwin
Paris
FIGURE 14.12 Determining an earthquake epicenter using the
distances obtained from three or more seismic stations—a method
called triangulation.
Measuring the Size of Earthquakes
Now we know the distance, but what about direction? The
epicenter could be in any direction from the seismic station. Using
a method called triangulation, the precise location can be determined using the distance from three or more seismic stations
(FIGURE 14.12). On a globe, a circle is drawn around each seismic
station. The radius of these circles is equal to the distance from the
seismic station to the epicenter. The point where the three circles
intersect is the epicenter of the quake.
C O N C E P T C H E C K 1 4 . 5
What information does a travel-time graph provide?
Briefly describe the triangulation method used to determine the
epicenter of an earthquake.
Measuring the Size
of Earthquakes
Historically, seismologists have employed a variety of methods to
determine two fundamentally different measures that describe the
size of an earthquake—intensity and magnitude. The first of these
to be used was intensity—a measure of the degree of earthquake
2
1
shaking at a given locale based on observed effects. Later, with the
development of seismographs, it became possible to measure
ground motion using instruments. This quantitative measurement,
called magnitude, relies on data gleaned from seismic records to
estimate the amount of energy released at an earthquake’ s source.
Intensity and magnitude provide useful, though different,
information about earthquake strength. Consequently, both
measures are used to describe earthquake severity.
Modified Mercalli Intensity Scale
Numerous intensity scales have been developed over the last
150 years. The one widely used is the Modified Mercalli Intensity
Scale—named after Giuseppe Mercalli, who initially developed it
in 1902 (TABLE 14.1). This intensity scale is divided into twelve
levels of severity based on observed effects such as people awakening from sleep, furniture moving, plaster cracking and falling, and
finally—total destruction. As Table 14.1 illustrates, the lower
numbers on the Mercalli scale (I-V) refer to what people in various
locations felt during the quake, whereas the higher numbers
(VI-XII) are based on observable damage to buildings and other
structures. FIGURE 14.13 shows shaking intensity maps for two San
Francisco Bay area quakes—1989 Loma Prieta and 1906 San Francisco earthquakes. Although the 1989 Loma Prieta quake caused
billions of dollars in damage and claimed more than 60 lives, these
shaking maps show that a repeat of the 1906 San Francisco earthquake would certainly be more catastrophic.
P - w a v e c u r v e
S - w a v e
c u r v e
Time in minutes
15
14
13
12
11
10
9
8
7
6
5
4
3
2
1
0
1000
2000
3000
Distance in kilometers
5 min.
time
interval
1000
2000
3000
4000
Distance in miles
500
1500
2500
FIGURE 14.11 A travel-time graph is used to determine the distance
to an earthquake epicenter. The difference in arrival time between
the first P wave and the first S wave in the example is 5 minutes. Thus,
the epicenter is roughly 3400 kilometers (2100 miles) away.
3 4 0 0
k m
8 2 0 0 k m
4 9 0 0 k m
Nagpur
Darwin
Paris
FIGURE 14.12 Determining an earthquake epicenter using the
distances obtained from three or more seismic stations—a method
called triangulation.