

second at the base of the mantle. P waves
can pass through Earth’ s mantle in about
20 minutes. Generally, in any solid material, P waves travel about 1.7 times faster
than S waves, and surface waves are
roughly 10 percent slower than S waves.
In addition to velocity differences,
notice in Figure 14.9 that the height, or
amplitude, of these wave types also varies.
S waves have slightly greater amplitudes
than P waves, while surface waves exhibit
even greater amplitudes. Surface waves
also retain their maximum amplitude
longer than P and S waves. As a result,
surface waves tend to cause greater ground
shaking, and hence greater destruction,
than either P or S waves.
Seismic waves are useful in determining the location and magnitude of
earthquakes. In addition, seismic waves
provide an important tool for probing
Earth’ s interior.
C O N C E P T C H E C K 1 4 . 4
Describe the principle of a seismograph.
List the major differences between P, S,
and surface waves.
Which type of seismic wave causes the
greatest destruction to buildings?
3
2
1
CHAPTER 14 Earthquakes and Earth’s Interior
342
Locating the Source
of an Earthquake
Earthquakes
Locating The Source of an Earthquake
When analyzing an earthquake, the first
task seismologists undertake is determining
its epicenter, the point on Earth’ s surface
directly above the focus (see Figure 14.2).
The method used for locating an earthquake’ s epicenter relies on the fact that
P waves travel faster than S waves.
The method is analogous to the results
of a race between two autos, one faster than
the other. The first P wave, like the faster
auto, always wins the race, arriving ahead
of the first S wave. The greater the length of
the race, the greater the difference in their
arrival times at the finish line (the seismic
station). Therefore, the greater the interval
between the arrival of the first P wave and
the arrival of the first S wave, the greater
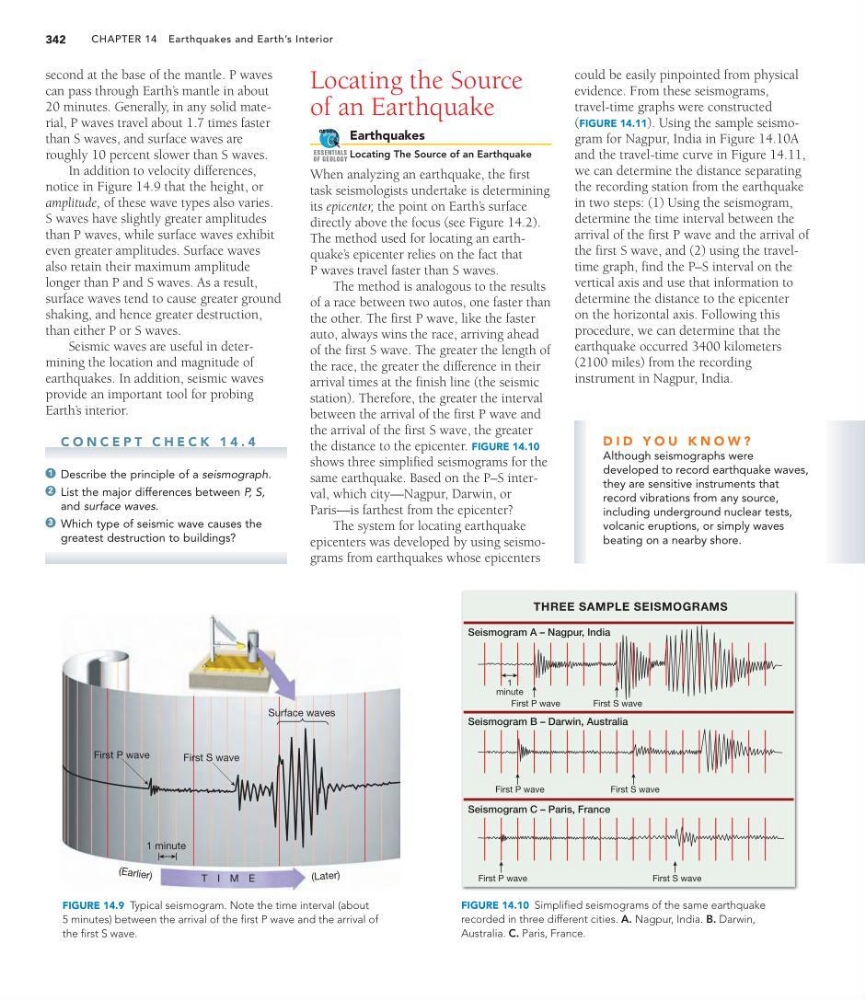
the distance to the epicenter. FIGURE 14.10
shows three simplified seismograms for the
same earthquake. Based on the P–S interval, which city—Nagpur, Darwin, or
Paris—is farthest from the epicenter?
The system for locating earthquake
epicenters was developed by using seismograms from earthquakes whose epicenters
GEODe
ESSENTIALS
OF GEOLOGY
could be easily pinpointed from physical
evidence. From these seismograms,
travel-time graphs were constructed
(FIGURE 14.11). Using the sample seismogram for Nagpur, India in Figure 14.10A
and the travel-time curve in Figure 14.11,
we can determine the distance separating
the recording station from the earthquake
in two steps: (1) Using the seismogram,
determine the time interval between the
arrival of the first P wave and the arrival of
the first S wave, and (2) using the traveltime graph, find the P–S interval on the
vertical axis and use that information to
determine the distance to the epicenter
on the horizontal axis. Following this
procedure, we can determine that the
earthquake occurred 3400 kilometers
(2100 miles) from the recording
instrument in Nagpur, India.
First P wave
First S wave
Surface waves
1 minute
T I M E
(E ar lie r)
(Late r)
FIGURE 14.9 Typical seismogram. Note the time interval (about
5 minutes) between the arrival of the first P wave and the arrival of
the first S wave.
First P wave
First S wave
First P wave
First S wave
First P wave
First S wave
Seismogram A – Nagpur, India
Seismogram B – Darwin, Australia
Seismogram C – Paris, France
1
minute
THREE SAMPLE SEISMOGRAMS
FIGURE 14.10 Simplified seismograms of the same earthquake
recorded in three different cities. A. Nagpur, India. B. Darwin,
Australia. C. Paris, France.
D I D Y O U K N O W ?
Although seismographs were
developed to record earthquake waves,
they are sensitive instruments that
record vibrations from any source,
including underground nuclear tests,
volcanic eruptions, or simply waves
beating on a nearby shore.
can pass through Earth’ s mantle in about
20 minutes. Generally, in any solid material, P waves travel about 1.7 times faster
than S waves, and surface waves are
roughly 10 percent slower than S waves.
In addition to velocity differences,
notice in Figure 14.9 that the height, or
amplitude, of these wave types also varies.
S waves have slightly greater amplitudes
than P waves, while surface waves exhibit
even greater amplitudes. Surface waves
also retain their maximum amplitude
longer than P and S waves. As a result,
surface waves tend to cause greater ground
shaking, and hence greater destruction,
than either P or S waves.
Seismic waves are useful in determining the location and magnitude of
earthquakes. In addition, seismic waves
provide an important tool for probing
Earth’ s interior.
C O N C E P T C H E C K 1 4 . 4
Describe the principle of a seismograph.
List the major differences between P, S,
and surface waves.
Which type of seismic wave causes the
greatest destruction to buildings?
3
2
1
CHAPTER 14 Earthquakes and Earth’s Interior
342
Locating the Source
of an Earthquake
Earthquakes
Locating The Source of an Earthquake
When analyzing an earthquake, the first
task seismologists undertake is determining
its epicenter, the point on Earth’ s surface
directly above the focus (see Figure 14.2).
The method used for locating an earthquake’ s epicenter relies on the fact that
P waves travel faster than S waves.
The method is analogous to the results
of a race between two autos, one faster than
the other. The first P wave, like the faster
auto, always wins the race, arriving ahead
of the first S wave. The greater the length of
the race, the greater the difference in their
arrival times at the finish line (the seismic
station). Therefore, the greater the interval
between the arrival of the first P wave and
the arrival of the first S wave, the greater
the distance to the epicenter. FIGURE 14.10
shows three simplified seismograms for the
same earthquake. Based on the P–S interval, which city—Nagpur, Darwin, or
Paris—is farthest from the epicenter?
The system for locating earthquake
epicenters was developed by using seismograms from earthquakes whose epicenters
GEODe
ESSENTIALS
OF GEOLOGY
could be easily pinpointed from physical
evidence. From these seismograms,
travel-time graphs were constructed
(FIGURE 14.11). Using the sample seismogram for Nagpur, India in Figure 14.10A
and the travel-time curve in Figure 14.11,
we can determine the distance separating
the recording station from the earthquake
in two steps: (1) Using the seismogram,
determine the time interval between the
arrival of the first P wave and the arrival of
the first S wave, and (2) using the traveltime graph, find the P–S interval on the
vertical axis and use that information to
determine the distance to the epicenter
on the horizontal axis. Following this
procedure, we can determine that the
earthquake occurred 3400 kilometers
(2100 miles) from the recording
instrument in Nagpur, India.
First P wave
First S wave
Surface waves
1 minute
T I M E
(E ar lie r)
(Late r)
FIGURE 14.9 Typical seismogram. Note the time interval (about
5 minutes) between the arrival of the first P wave and the arrival of
the first S wave.
First P wave
First S wave
First P wave
First S wave
First P wave
First S wave
Seismogram A – Nagpur, India
Seismogram B – Darwin, Australia
Seismogram C – Paris, France
1
minute
THREE SAMPLE SEISMOGRAMS
FIGURE 14.10 Simplified seismograms of the same earthquake
recorded in three different cities. A. Nagpur, India. B. Darwin,
Australia. C. Paris, France.
D I D Y O U K N O W ?
Although seismographs were
developed to record earthquake waves,
they are sensitive instruments that
record vibrations from any source,
including underground nuclear tests,
volcanic eruptions, or simply waves
beating on a nearby shore.