

Polar high
Polar easterlies
Polar easterlies
NE NE
trade winds
trade winds
SE SE
trade winds
trade winds
Westerlies Westerlies
Polar easterlies
Polar front
NE
trade winds
SE
trade winds
Westerlies
A.
B.
0°
30°
60°
Subpolar
low
E q u a to ri al lo w
S u b t r o p ic a l h ig h
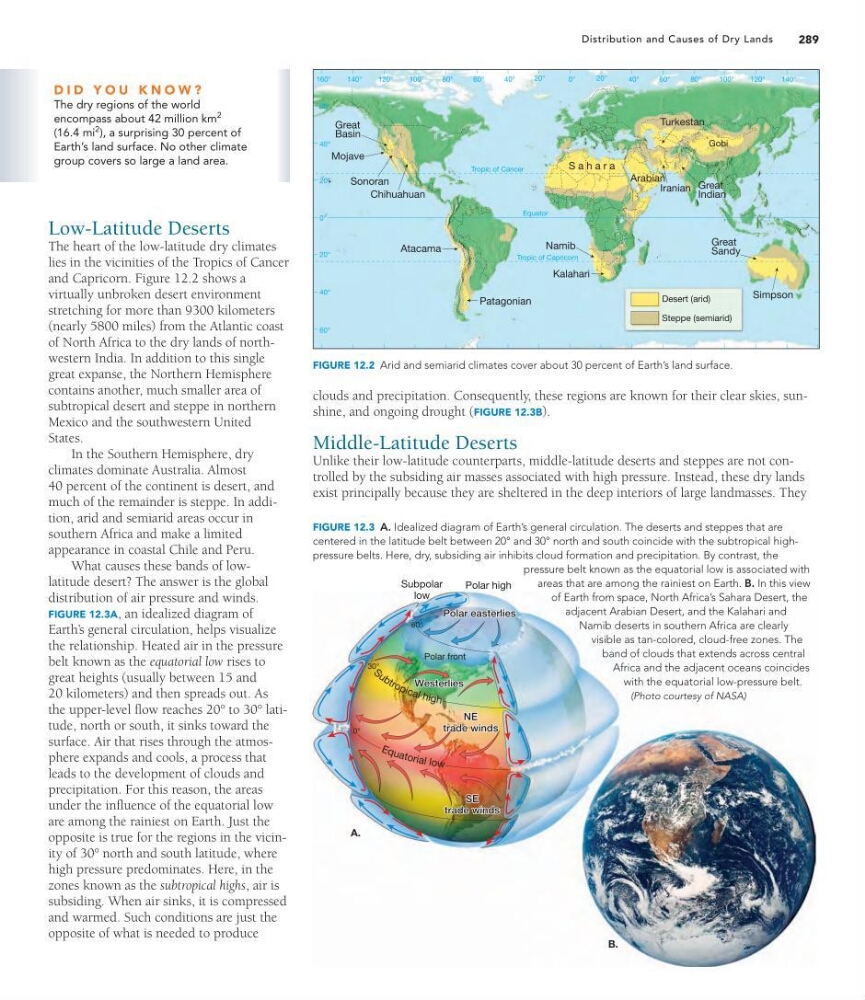
FIGURE 12.3 A. Idealized diagram of Earth’s general circulation. The deserts and steppes that are
centered in the latitude belt between 20° and 30° north and south coincide with the subtropical highpressure belts. Here, dry, subsiding air inhibits cloud formation and precipitation. By contrast, the
pressure belt known as the equatorial low is associated with
areas that are among the rainiest on Earth. B. In this view
of Earth from space, North Africa’s Sahara Desert, the
adjacent Arabian Desert, and the Kalahari and
Namib deserts in southern Africa are clearly
visible as tan-colored, cloud-free zones. The
band of clouds that extends across central
Africa and the adjacent oceans coincides
with the equatorial low-pressure belt.
(Photo courtesy of NASA)
289
Distribution and Causes of Dry Lands
D I D Y O U K N O W ?
The dry regions of the world
encompass about 42 million km
2
(16.4 mi
2 ), a surprising 30 percent of
Earth’s land surface. No other climate
group covers so large a land area.
Low-Latitude Deserts
The heart of the low-latitude dry climates
lies in the vicinities of the Tropics of Cancer
and Capricorn. Figure 12.2 shows a
virtually unbroken desert environment
stretching for more than 9300 kilometers
(nearly 5800 miles) from the Atlantic coast
of North Africa to the dry lands of northwestern India. In addition to this single
great expanse, the Northern Hemisphere
contains another, much smaller area of
subtropical desert and steppe in northern
Mexico and the southwestern United
States.
In the Southern Hemisphere, dry
climates dominate Australia. Almost
40 percent of the continent is desert, and
much of the remainder is steppe. In addition, arid and semiarid areas occur in
southern Africa and make a limited
appearance in coastal Chile and Peru.
What causes these bands of lowlatitude desert? The answer is the global
distribution of air pressure and winds.
FIGURE 12.3A, an idealized diagram of
Earth’ s general circulation, helps visualize
the relationship. Heated air in the pressure
belt known as the equatorial low rises to
great heights (usually between 15 and
20 kilometers) and then spreads out. As
the upper-level flow reaches 20° to 30° latitude, north or south, it sinks toward the
surface. Air that rises through the atmosphere expands and cools, a process that
leads to the development of clouds and
precipitation. For this reason, the areas
under the influence of the equatorial low
are among the rainiest on Earth. Just the
opposite is true for the regions in the vicinity of 30° north and south latitude, where
high pressure predominates. Here, in the
zones known as the subtropical highs, air is
subsiding. When air sinks, it is compressed
and warmed. Such conditions are just the
opposite of what is needed to produce
Tropic of Cancer
Tropic of Capricorn
Equator
20°
0°
20°
60°
40°
40°
60°
140°
120°
100°
40°
60°
80°
140°
80°
60°
40°
0°
20°
20°
100°
120°
160°
Desert (arid)
Steppe (semiarid)
Great
Basin
Sonoran
Atacama
Patagonian
Kalahari
Namib
S a h a r a
Iranian
Turkestan
Gobi
Great
Indian
Great
Sandy
Simpson
Arabian
Chihuahuan
Mojave
FIGURE 12.2 Arid and semiarid climates cover about 30 percent of Earth’s land surface.
clouds and precipitation. Consequently, these regions are known for their clear skies, sunshine, and ongoing drought (FIGURE 12.3B).
Middle-Latitude Deserts
Unlike their low-latitude counterparts, middle-latitude deserts and steppes are not controlled by the subsiding air masses associated with high pressure. Instead, these dry lands
exist principally because they are sheltered in the deep interiors of large landmasses. They
Polar easterlies
Polar easterlies
NE NE
trade winds
trade winds
SE SE
trade winds
trade winds
Westerlies Westerlies
Polar easterlies
Polar front
NE
trade winds
SE
trade winds
Westerlies
A.
B.
0°
30°
60°
Subpolar
low
E q u a to ri al lo w
S u b t r o p ic a l h ig h
FIGURE 12.3 A. Idealized diagram of Earth’s general circulation. The deserts and steppes that are
centered in the latitude belt between 20° and 30° north and south coincide with the subtropical highpressure belts. Here, dry, subsiding air inhibits cloud formation and precipitation. By contrast, the
pressure belt known as the equatorial low is associated with
areas that are among the rainiest on Earth. B. In this view
of Earth from space, North Africa’s Sahara Desert, the
adjacent Arabian Desert, and the Kalahari and
Namib deserts in southern Africa are clearly
visible as tan-colored, cloud-free zones. The
band of clouds that extends across central
Africa and the adjacent oceans coincides
with the equatorial low-pressure belt.
(Photo courtesy of NASA)
289
Distribution and Causes of Dry Lands
D I D Y O U K N O W ?
The dry regions of the world
encompass about 42 million km
2
(16.4 mi
2 ), a surprising 30 percent of
Earth’s land surface. No other climate
group covers so large a land area.
Low-Latitude Deserts
The heart of the low-latitude dry climates
lies in the vicinities of the Tropics of Cancer
and Capricorn. Figure 12.2 shows a
virtually unbroken desert environment
stretching for more than 9300 kilometers
(nearly 5800 miles) from the Atlantic coast
of North Africa to the dry lands of northwestern India. In addition to this single
great expanse, the Northern Hemisphere
contains another, much smaller area of
subtropical desert and steppe in northern
Mexico and the southwestern United
States.
In the Southern Hemisphere, dry
climates dominate Australia. Almost
40 percent of the continent is desert, and
much of the remainder is steppe. In addition, arid and semiarid areas occur in
southern Africa and make a limited
appearance in coastal Chile and Peru.
What causes these bands of lowlatitude desert? The answer is the global
distribution of air pressure and winds.
FIGURE 12.3A, an idealized diagram of
Earth’ s general circulation, helps visualize
the relationship. Heated air in the pressure
belt known as the equatorial low rises to
great heights (usually between 15 and
20 kilometers) and then spreads out. As
the upper-level flow reaches 20° to 30° latitude, north or south, it sinks toward the
surface. Air that rises through the atmosphere expands and cools, a process that
leads to the development of clouds and
precipitation. For this reason, the areas
under the influence of the equatorial low
are among the rainiest on Earth. Just the
opposite is true for the regions in the vicinity of 30° north and south latitude, where
high pressure predominates. Here, in the
zones known as the subtropical highs, air is
subsiding. When air sinks, it is compressed
and warmed. Such conditions are just the
opposite of what is needed to produce
Tropic of Cancer
Tropic of Capricorn
Equator
20°
0°
20°
60°
40°
40°
60°
140°
120°
100°
40°
60°
80°
140°
80°
60°
40°
0°
20°
20°
100°
120°
160°
Desert (arid)
Steppe (semiarid)
Great
Basin
Sonoran
Atacama
Patagonian
Kalahari
Namib
S a h a r a
Iranian
Turkestan
Gobi
Great
Indian
Great
Sandy
Simpson
Arabian
Chihuahuan
Mojave
FIGURE 12.2 Arid and semiarid climates cover about 30 percent of Earth’s land surface.
clouds and precipitation. Consequently, these regions are known for their clear skies, sunshine, and ongoing drought (FIGURE 12.3B).
Middle-Latitude Deserts
Unlike their low-latitude counterparts, middle-latitude deserts and steppes are not controlled by the subsiding air masses associated with high pressure. Instead, these dry lands
exist principally because they are sheltered in the deep interiors of large landmasses. They