

269
Glacial Erosion
2-kilometer wide swath of land between
New York and Los Angeles with a glacier
1 kilometer thick.
GREENLAND’S GLACIAL BUDGET. Is
the Greenland ice sheet growing or
shrinking? Answering this relatively
simple question is not a simple task and is
much more difficult for ice sheets than for
valley glaciers. Accurate answers require
large quantities of data. Conducting field
studies on an ice sheet poses significant
challenges—sampling a huge area with an
extreme climate in a remote part of the
world over an extended time span. Data
can only be collected for short periods
each year at widely scattered sites. The
information gathered by such studies,
though useful, provided only a glimpse
into what was happening on the
Greenland ice sheet. However, in recent
years satellite observations have started to
provide scientists with the data they need
FIGURE 11.13 Two images taken 63 years apart
from the same spot in Alaska’s Glacier Bay
National Park. Muir Glacier, which is prominent in
the 1941 photo, has retreated out of the field of
view in the 2004 image. Also Riggs Glacier
(upper right) has thinned and retreated
significantly. (Photos courtesy of National Snow
and Ice Data Center)
to begin to determine whether the
margins of the ice sheet are melting faster
than the interior is gaining ice (net loss)
or whether the interior is adding new ice
faster than the edges are wasting away
(net gain).
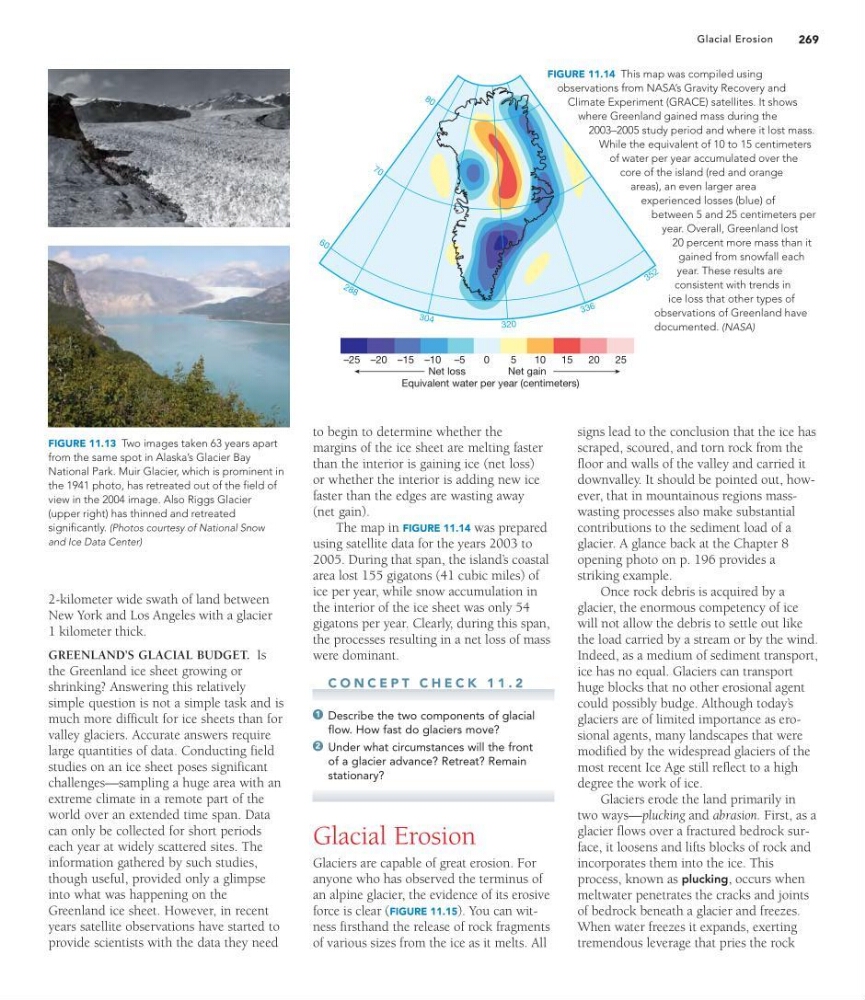
The map in FIGURE 11.14 was prepared
using satellite data for the years 2003 to
2005. During that span, the island’ s coastal
area lost 155 gigatons (41 cubic miles) of
ice per year, while snow accumulation in
the interior of the ice sheet was only 54
gigatons per year. Clearly, during this span,
the processes resulting in a net loss of mass
were dominant.
C O N C E P T C H E C K 1 1 . 2
Describe the two components of glacial
flow. How fast do glaciers move?
Under what circumstances will the front
of a glacier advance? Retreat? Remain
stationary?
Glacial Erosion
Glaciers are capable of great erosion. For
anyone who has observed the terminus of
an alpine glacier, the evidence of its erosive
force is clear (FIGURE 11.15). You can witness firsthand the release of rock fragments
of various sizes from the ice as it melts. All
2
1
signs lead to the conclusion that the ice has
scraped, scoured, and torn rock from the
floor and walls of the valley and carried it
downvalley. It should be pointed out, however, that in mountainous regions masswasting processes also make substantial
contributions to the sediment load of a
glacier. A glance back at the Chapter 8
opening photo on p. 196 provides a
striking example.
Once rock debris is acquired by a
glacier, the enormous competency of ice
will not allow the debris to settle out like
the load carried by a stream or by the wind.
Indeed, as a medium of sediment transport,
ice has no equal. Glaciers can transport
huge blocks that no other erosional agent
could possibly budge. Although today’ s
glaciers are of limited importance as erosional agents, many landscapes that were
modified by the widespread glaciers of the
most recent Ice Age still reflect to a high
degree the work of ice.
Glaciers erode the land primarily in
two ways—plucking and abrasion. First, as a
glacier flows over a fractured bedrock surface, it loosens and lifts blocks of rock and
incorporates them into the ice. This
process, known as plucking, occurs when
meltwater penetrates the cracks and joints
of bedrock beneath a glacier and freezes.
When water freezes it expands, exerting
tremendous leverage that pries the rock
Net loss
Net gain
Equivalent water per year (centimeters)
8 0
–25 –20
–10 –5
5
0
10
15
20
25
–15
7 0
6 0
2 8 8
30 4
320
3 3 6
3 5 2
FIGURE 11.14 This map was compiled using
observations from NASA’s Gravity Recovery and
Climate Experiment (GRACE) satellites. It shows
where Greenland gained mass during the
2003–2005 study period and where it lost mass.
While the equivalent of 10 to 15 centimeters
of water per year accumulated over the
core of the island (red and orange
areas), an even larger area
experienced losses (blue) of
between 5 and 25 centimeters per
year. Overall, Greenland lost
20 percent more mass than it
gained from snowfall each
year. These results are
consistent with trends in
ice loss that other types of
observations of Greenland have
documented. (NASA)
Glacial Erosion
2-kilometer wide swath of land between
New York and Los Angeles with a glacier
1 kilometer thick.
GREENLAND’S GLACIAL BUDGET. Is
the Greenland ice sheet growing or
shrinking? Answering this relatively
simple question is not a simple task and is
much more difficult for ice sheets than for
valley glaciers. Accurate answers require
large quantities of data. Conducting field
studies on an ice sheet poses significant
challenges—sampling a huge area with an
extreme climate in a remote part of the
world over an extended time span. Data
can only be collected for short periods
each year at widely scattered sites. The
information gathered by such studies,
though useful, provided only a glimpse
into what was happening on the
Greenland ice sheet. However, in recent
years satellite observations have started to
provide scientists with the data they need
FIGURE 11.13 Two images taken 63 years apart
from the same spot in Alaska’s Glacier Bay
National Park. Muir Glacier, which is prominent in
the 1941 photo, has retreated out of the field of
view in the 2004 image. Also Riggs Glacier
(upper right) has thinned and retreated
significantly. (Photos courtesy of National Snow
and Ice Data Center)
to begin to determine whether the
margins of the ice sheet are melting faster
than the interior is gaining ice (net loss)
or whether the interior is adding new ice
faster than the edges are wasting away
(net gain).
The map in FIGURE 11.14 was prepared
using satellite data for the years 2003 to
2005. During that span, the island’ s coastal
area lost 155 gigatons (41 cubic miles) of
ice per year, while snow accumulation in
the interior of the ice sheet was only 54
gigatons per year. Clearly, during this span,
the processes resulting in a net loss of mass
were dominant.
C O N C E P T C H E C K 1 1 . 2
Describe the two components of glacial
flow. How fast do glaciers move?
Under what circumstances will the front
of a glacier advance? Retreat? Remain
stationary?
Glacial Erosion
Glaciers are capable of great erosion. For
anyone who has observed the terminus of
an alpine glacier, the evidence of its erosive
force is clear (FIGURE 11.15). You can witness firsthand the release of rock fragments
of various sizes from the ice as it melts. All
2
1
signs lead to the conclusion that the ice has
scraped, scoured, and torn rock from the
floor and walls of the valley and carried it
downvalley. It should be pointed out, however, that in mountainous regions masswasting processes also make substantial
contributions to the sediment load of a
glacier. A glance back at the Chapter 8
opening photo on p. 196 provides a
striking example.
Once rock debris is acquired by a
glacier, the enormous competency of ice
will not allow the debris to settle out like
the load carried by a stream or by the wind.
Indeed, as a medium of sediment transport,
ice has no equal. Glaciers can transport
huge blocks that no other erosional agent
could possibly budge. Although today’ s
glaciers are of limited importance as erosional agents, many landscapes that were
modified by the widespread glaciers of the
most recent Ice Age still reflect to a high
degree the work of ice.
Glaciers erode the land primarily in
two ways—plucking and abrasion. First, as a
glacier flows over a fractured bedrock surface, it loosens and lifts blocks of rock and
incorporates them into the ice. This
process, known as plucking, occurs when
meltwater penetrates the cracks and joints
of bedrock beneath a glacier and freezes.
When water freezes it expands, exerting
tremendous leverage that pries the rock
Net loss
Net gain
Equivalent water per year (centimeters)
8 0
–25 –20
–10 –5
5
0
10
15
20
25
–15
7 0
6 0
2 8 8
30 4
320
3 3 6
3 5 2
FIGURE 11.14 This map was compiled using
observations from NASA’s Gravity Recovery and
Climate Experiment (GRACE) satellites. It shows
where Greenland gained mass during the
2003–2005 study period and where it lost mass.
While the equivalent of 10 to 15 centimeters
of water per year accumulated over the
core of the island (red and orange
areas), an even larger area
experienced losses (blue) of
between 5 and 25 centimeters per
year. Overall, Greenland lost
20 percent more mass than it
gained from snowfall each
year. These results are
consistent with trends in
ice loss that other types of
observations of Greenland have
documented. (NASA)