

D is c h a rg e
C
h
a
n
n
e
l
r
o
u
g
h
n
e
s
s
Ch an nel size
C
h
a
n
n
e
l
s
l
o
p e
Flow velocity
Headwaters
Increase
Mouth
Head
Elevation (km)
0
50
100
150
4
3
2
1
0
Distance (km)
Fresno,
CA
Mt. Whitney
K in g s R i v
e r
S i e r r a
N e v a d a
Mouth
Longitudinal profile
downstream where it empties into another
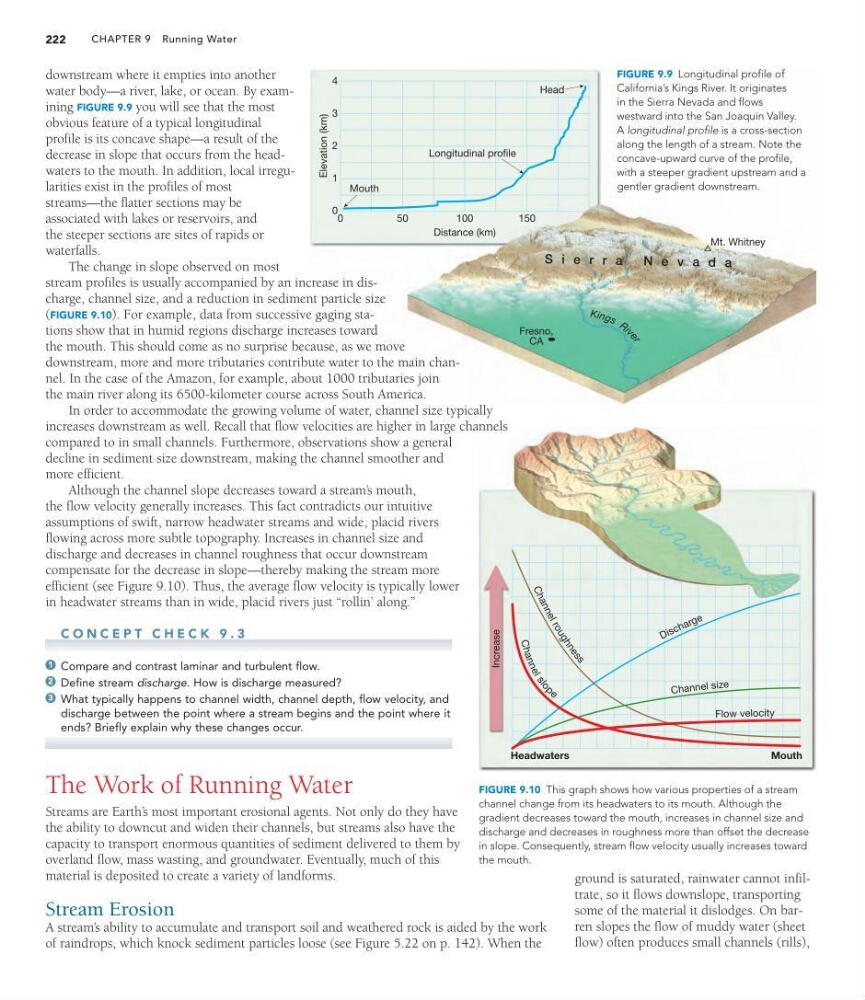
water body—a river, lake, or ocean. By examining FIGURE 9.9 you will see that the most
obvious feature of a typical longitudinal
profile is its concave shape—a result of the
decrease in slope that occurs from the headwaters to the mouth. In addition, local irregularities exist in the profiles of most
streams—the flatter sections may be
associated with lakes or reservoirs, and
the steeper sections are sites of rapids or
waterfalls.
The change in slope observed on most
stream profiles is usually accompanied by an increase in discharge, channel size, and a reduction in sediment particle size
(FIGURE 9.10). For example, data from successive gaging stations show that in humid regions discharge increases toward
the mouth. This should come as no surprise because, as we move
downstream, more and more tributaries contribute water to the main channel. In the case of the Amazon, for example, about 1000 tributaries join
the main river along its 6500-kilometer course across South America.
In order to accommodate the growing volume of water, channel size typically
increases downstream as well. Recall that flow velocities are higher in large channels
compared to in small channels. Furthermore, observations show a general
decline in sediment size downstream, making the channel smoother and
more efficient.
Although the channel slope decreases toward a stream’ s mouth,
the flow velocity generally increases. This fact contradicts our intuitive
assumptions of swift, narrow headwater streams and wide, placid rivers
flowing across more subtle topography. Increases in channel size and
discharge and decreases in channel roughness that occur downstream
compensate for the decrease in slope—thereby making the stream more
efficient (see Figure 9.10). Thus, the average flow velocity is typically lower
in headwater streams than in wide, placid rivers just “rollin’ along.”
C O N C E P T C H E C K 9 . 3
Compare and contrast laminar and turbulent flow.
Define stream discharge. How is discharge measured?
What typically happens to channel width, channel depth, flow velocity, and
discharge between the point where a stream begins and the point where it
ends? Briefly explain why these changes occur.
The Work of Running Water
Streams are Earth’ s most important erosional agents. Not only do they have
the ability to downcut and widen their channels, but streams also have the
capacity to transport enormous quantities of sediment delivered to them by
overland flow, mass wasting, and groundwater. Eventually, much of this
material is deposited to create a variety of landforms.
Stream Erosion
A stream’ s ability to accumulate and transport soil and weathered rock is aided by the work
of raindrops, which knock sediment particles loose (see Figure 5.22 on p. 142). When the
3
2
1
CHAPTER 9 Running Water
222
FIGURE 9.9 Longitudinal profile of
California’s Kings River. It originates
in the Sierra Nevada and flows
westward into the San Joaquin Valley.
A longitudinal profile is a cross-section
along the length of a stream. Note the
concave-upward curve of the profile,
with a steeper gradient upstream and a
gentler gradient downstream.
FIGURE 9.10 This graph shows how various properties of a stream
channel change from its headwaters to its mouth. Although the
gradient decreases toward the mouth, increases in channel size and
discharge and decreases in roughness more than offset the decrease
in slope. Consequently, stream flow velocity usually increases toward
the mouth.
ground is saturated, rainwater cannot infiltrate, so it flows downslope, transporting
some of the material it dislodges. On barren slopes the flow of muddy water (sheet
flow) often produces small channels (rills),
C
h
a
n
n
e
l
r
o
u
g
h
n
e
s
s
Ch an nel size
C
h
a
n
n
e
l
s
l
o
p e
Flow velocity
Headwaters
Increase
Mouth
Head
Elevation (km)
0
50
100
150
4
3
2
1
0
Distance (km)
Fresno,
CA
Mt. Whitney
K in g s R i v
e r
S i e r r a
N e v a d a
Mouth
Longitudinal profile
downstream where it empties into another
water body—a river, lake, or ocean. By examining FIGURE 9.9 you will see that the most
obvious feature of a typical longitudinal
profile is its concave shape—a result of the
decrease in slope that occurs from the headwaters to the mouth. In addition, local irregularities exist in the profiles of most
streams—the flatter sections may be
associated with lakes or reservoirs, and
the steeper sections are sites of rapids or
waterfalls.
The change in slope observed on most
stream profiles is usually accompanied by an increase in discharge, channel size, and a reduction in sediment particle size
(FIGURE 9.10). For example, data from successive gaging stations show that in humid regions discharge increases toward
the mouth. This should come as no surprise because, as we move
downstream, more and more tributaries contribute water to the main channel. In the case of the Amazon, for example, about 1000 tributaries join
the main river along its 6500-kilometer course across South America.
In order to accommodate the growing volume of water, channel size typically
increases downstream as well. Recall that flow velocities are higher in large channels
compared to in small channels. Furthermore, observations show a general
decline in sediment size downstream, making the channel smoother and
more efficient.
Although the channel slope decreases toward a stream’ s mouth,
the flow velocity generally increases. This fact contradicts our intuitive
assumptions of swift, narrow headwater streams and wide, placid rivers
flowing across more subtle topography. Increases in channel size and
discharge and decreases in channel roughness that occur downstream
compensate for the decrease in slope—thereby making the stream more
efficient (see Figure 9.10). Thus, the average flow velocity is typically lower
in headwater streams than in wide, placid rivers just “rollin’ along.”
C O N C E P T C H E C K 9 . 3
Compare and contrast laminar and turbulent flow.
Define stream discharge. How is discharge measured?
What typically happens to channel width, channel depth, flow velocity, and
discharge between the point where a stream begins and the point where it
ends? Briefly explain why these changes occur.
The Work of Running Water
Streams are Earth’ s most important erosional agents. Not only do they have
the ability to downcut and widen their channels, but streams also have the
capacity to transport enormous quantities of sediment delivered to them by
overland flow, mass wasting, and groundwater. Eventually, much of this
material is deposited to create a variety of landforms.
Stream Erosion
A stream’ s ability to accumulate and transport soil and weathered rock is aided by the work
of raindrops, which knock sediment particles loose (see Figure 5.22 on p. 142). When the
3
2
1
CHAPTER 9 Running Water
222
FIGURE 9.9 Longitudinal profile of
California’s Kings River. It originates
in the Sierra Nevada and flows
westward into the San Joaquin Valley.
A longitudinal profile is a cross-section
along the length of a stream. Note the
concave-upward curve of the profile,
with a steeper gradient upstream and a
gentler gradient downstream.
FIGURE 9.10 This graph shows how various properties of a stream
channel change from its headwaters to its mouth. Although the
gradient decreases toward the mouth, increases in channel size and
discharge and decreases in roughness more than offset the decrease
in slope. Consequently, stream flow velocity usually increases toward
the mouth.
ground is saturated, rainwater cannot infiltrate, so it flows downslope, transporting
some of the material it dislodges. On barren slopes the flow of muddy water (sheet
flow) often produces small channels (rills),