

221
Streamflow
result, if all other factors are equal, the
water will flow more efficiently and at a
higher velocity in channel B than in
channel A.
Water depth also affects the frictional
resistance the channel exerts on flow.
Maximum flow velocity occurs when a
stream is bankfull, before water starts to
inundate the floodplain. At this stage, the
channel’ s ratio of the cross-sectional area
to wetted perimeter is highest and stream
flow is most efficient. Similarly, an
increase in channel size increases the ratio
of cross-sectional area to wetted perimeter
and therefore increases channel efficiency.
All other factors being equal, flow velocities
are higher in large channels than in small
channels.
Most streams have channels that can be
described as rough. Elements such as boulders, irregularities in the channel bed, and
woody debris create turbulence that significantly impedes flow.
Discharge
Streams vary in size from small headwater
creeks less than a meter wide to large rivers
with widths of several kilometers. The size
of a stream channel is largely determined
by the amount of water supplied from the
drainage basin. The measure most often
used to compare the size of streams is
discharge—the volume of water flowing
past a certain point in a given unit of
time. Discharge, usually measured in
cubic meters per second or cubic feet per
second, is determined by multiplying
a stream’ s cross-sectional area by its
velocity.
TABLE 9.1 lists the world’ s largest
rivers in terms of discharge. The largest
river in North America, the Mississippi, has
a discharge that averages 17,300
cubic meters per second. Nevertheless, that
amount is dwarfed by South
America’ s mighty Amazon, which discharges 12 times more water than the
Mississippi. In fact, it has been estimated
that the flow of the Amazon accounts for
about 15 percent of all the fresh water
transported to the ocean by all of the
world’ s rivers. Just one day’ s discharge
would supply the water needs of New York
City for nine years!
The discharge of a river system changes
over time because of variations in the
amount of precipitation received by the
drainage basin. Studies show that when
discharge increases, the width, depth, and
flow velocity of the channel all increase
predictably. As we saw earlier, when the
size of the channel increases, proportionally
less water is in contact with the bed and
banks of the channel. Thus, friction is
reduced, resulting in an increase in the rate
of flow.
Changes Downstream
One useful way of studying a stream is to
examine its longitudinal profile. Such a
profile is simply a cross-sectional view of a
stream from its source area (called the head
or headwaters) to its mouth, the point
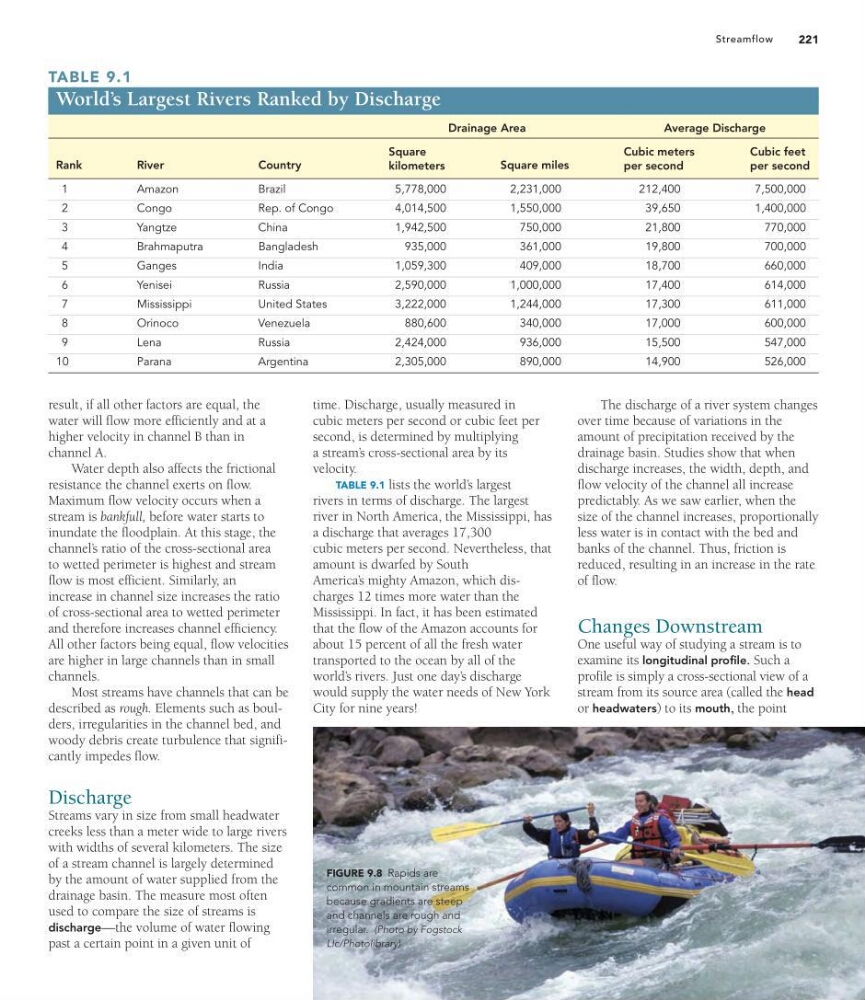
FIGURE 9.8 Rapids are
common in mountain streams
because gradients are steep
and channels are rough and
irregular. (Photo by Fogstock
Llc/Photolibrary)
TABLE 9.1
World’s Largest Rivers Ranked by Discharge
Drainage Area
Average Discharge
Rank
River
Country
Square
kilometers
Square miles
Cubic meters
per second
Cubic feet
per second
1
Amazon
Brazil
5,778,000
2,231,000
212,400
7,500,000
2
Congo
Rep. of Congo
4,014,500
1,550,000
39,650
1,400,000
3
Yangtze
China
1,942,500
750,000
21,800
770,000
4
Brahmaputra
Bangladesh
935,000
361,000
19,800
700,000
5
Ganges
India
1,059,300
409,000
18,700
660,000
6
Yenisei
Russia
2,590,000
1,000,000
17,400
614,000
7
Mississippi
United States
3,222,000
1,244,000
17,300
611,000
8
Orinoco
Venezuela
880,600
340,000
17,000
600,000
9
Lena
Russia
2,424,000
936,000
15,500
547,000
10
Parana
Argentina
2,305,000
890,000
14,900
526,000
Streamflow
result, if all other factors are equal, the
water will flow more efficiently and at a
higher velocity in channel B than in
channel A.
Water depth also affects the frictional
resistance the channel exerts on flow.
Maximum flow velocity occurs when a
stream is bankfull, before water starts to
inundate the floodplain. At this stage, the
channel’ s ratio of the cross-sectional area
to wetted perimeter is highest and stream
flow is most efficient. Similarly, an
increase in channel size increases the ratio
of cross-sectional area to wetted perimeter
and therefore increases channel efficiency.
All other factors being equal, flow velocities
are higher in large channels than in small
channels.
Most streams have channels that can be
described as rough. Elements such as boulders, irregularities in the channel bed, and
woody debris create turbulence that significantly impedes flow.
Discharge
Streams vary in size from small headwater
creeks less than a meter wide to large rivers
with widths of several kilometers. The size
of a stream channel is largely determined
by the amount of water supplied from the
drainage basin. The measure most often
used to compare the size of streams is
discharge—the volume of water flowing
past a certain point in a given unit of
time. Discharge, usually measured in
cubic meters per second or cubic feet per
second, is determined by multiplying
a stream’ s cross-sectional area by its
velocity.
TABLE 9.1 lists the world’ s largest
rivers in terms of discharge. The largest
river in North America, the Mississippi, has
a discharge that averages 17,300
cubic meters per second. Nevertheless, that
amount is dwarfed by South
America’ s mighty Amazon, which discharges 12 times more water than the
Mississippi. In fact, it has been estimated
that the flow of the Amazon accounts for
about 15 percent of all the fresh water
transported to the ocean by all of the
world’ s rivers. Just one day’ s discharge
would supply the water needs of New York
City for nine years!
The discharge of a river system changes
over time because of variations in the
amount of precipitation received by the
drainage basin. Studies show that when
discharge increases, the width, depth, and
flow velocity of the channel all increase
predictably. As we saw earlier, when the
size of the channel increases, proportionally
less water is in contact with the bed and
banks of the channel. Thus, friction is
reduced, resulting in an increase in the rate
of flow.
Changes Downstream
One useful way of studying a stream is to
examine its longitudinal profile. Such a
profile is simply a cross-sectional view of a
stream from its source area (called the head
or headwaters) to its mouth, the point
FIGURE 9.8 Rapids are
common in mountain streams
because gradients are steep
and channels are rough and
irregular. (Photo by Fogstock
Llc/Photolibrary)
TABLE 9.1
World’s Largest Rivers Ranked by Discharge
Drainage Area
Average Discharge
Rank
River
Country
Square
kilometers
Square miles
Cubic meters
per second
Cubic feet
per second
1
Amazon
Brazil
5,778,000
2,231,000
212,400
7,500,000
2
Congo
Rep. of Congo
4,014,500
1,550,000
39,650
1,400,000
3
Yangtze
China
1,942,500
750,000
21,800
770,000
4
Brahmaputra
Bangladesh
935,000
361,000
19,800
700,000
5
Ganges
India
1,059,300
409,000
18,700
660,000
6
Yenisei
Russia
2,590,000
1,000,000
17,400
614,000
7
Mississippi
United States
3,222,000
1,244,000
17,300
611,000
8
Orinoco
Venezuela
880,600
340,000
17,000
600,000
9
Lena
Russia
2,424,000
936,000
15,500
547,000
10
Parana
Argentina
2,305,000
890,000
14,900
526,000