

3.1 PHYSICAL PROPERTIES OF PARTICLES
5 1
mm diam.
Granules ~J~-Sand
.l~---Silt--~--C lay
4.0
2.0
1.0
0.5
0.25
0.125 0.0625 0.0039
100
75
5o
5o g ~
f 4~ 3O ~
25
I0
0
1
r
-2
-I
0
I
2
5
4
8
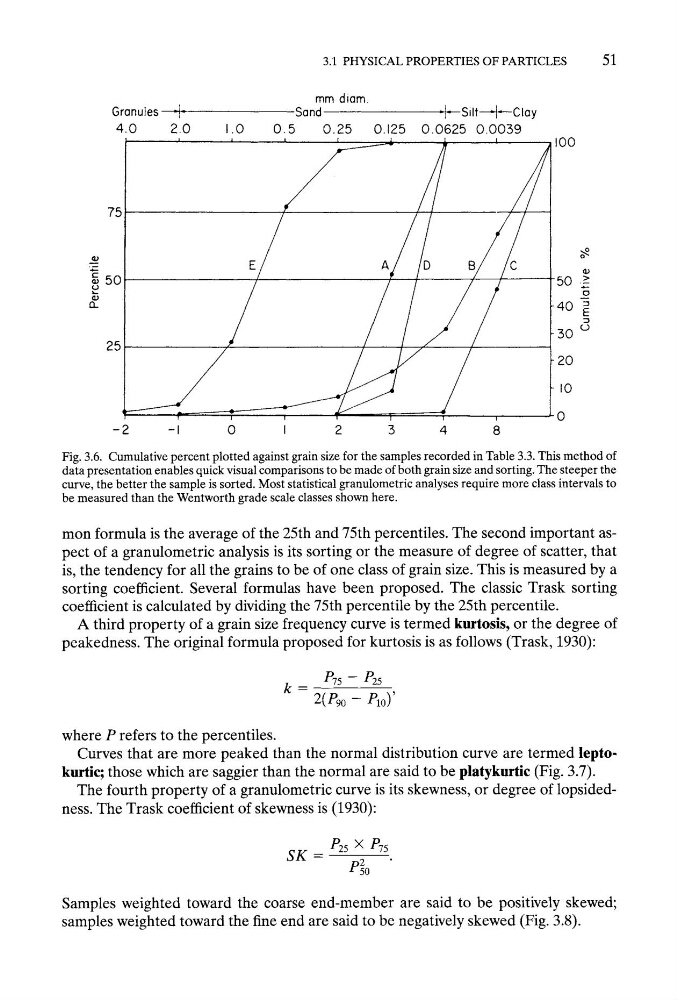
Fig. 3.6. Cumulative percent plotted against grain size for the samples recorded in Table 3.3. This method of
data presentation enables quick visual comparisons to be made of both grain size and sorting. The steeper the
curve, the better the sample is sorted. Most statistical granulometric analyses require more class intervals to
be measured than the Wentworth grade scale classes shown here.
mon formula is the average of the 25th and 75th percentiles. The second important aspect of a granulometric analysis is its sorting or the measure of degree of scatter, that
is, the tendency for all the grains to be of one class of grain size. This is measured by a
sorting coefficient. Several formulas have been proposed. The classic Trask sorting
coefficient is calculated by dividing the 75th percentile by the 25th percentile.
A third property of a grain size frequency curve is termed kurtosis, or the degree of
peakedness. The original formula proposed for kurtosis is as follows (Trask, 1930):
k
P75 - P25
2(P90- Pa0)'
where P refers to the percentiles.
Curves that are more peaked than the normal distribution curve are termed leptokurtie; those which are saggier than the normal are said to be platykurtie (Fig. 3.7).
The fourth property of a granulometric curve is its skewness, or degree of lopsidedness. The Trask coefficient of skewness is (1930):
SK=
P25 x/~
P20
Samples weighted toward the coarse end-member are said to be positively skewed;
samples weighted toward the fine end are said to be negatively skewed (Fig. 3.8).
5 1
mm diam.
Granules ~J~-Sand
.l~---Silt--~--C lay
4.0
2.0
1.0
0.5
0.25
0.125 0.0625 0.0039
100
75
5o
5o g ~
f 4~ 3O ~
25
I0
0
1
r
-2
-I
0
I
2
5
4
8
Fig. 3.6. Cumulative percent plotted against grain size for the samples recorded in Table 3.3. This method of
data presentation enables quick visual comparisons to be made of both grain size and sorting. The steeper the
curve, the better the sample is sorted. Most statistical granulometric analyses require more class intervals to
be measured than the Wentworth grade scale classes shown here.
mon formula is the average of the 25th and 75th percentiles. The second important aspect of a granulometric analysis is its sorting or the measure of degree of scatter, that
is, the tendency for all the grains to be of one class of grain size. This is measured by a
sorting coefficient. Several formulas have been proposed. The classic Trask sorting
coefficient is calculated by dividing the 75th percentile by the 25th percentile.
A third property of a grain size frequency curve is termed kurtosis, or the degree of
peakedness. The original formula proposed for kurtosis is as follows (Trask, 1930):
k
P75 - P25
2(P90- Pa0)'
where P refers to the percentiles.
Curves that are more peaked than the normal distribution curve are termed leptokurtie; those which are saggier than the normal are said to be platykurtie (Fig. 3.7).
The fourth property of a granulometric curve is its skewness, or degree of lopsidedness. The Trask coefficient of skewness is (1930):
SK=
P25 x/~
P20
Samples weighted toward the coarse end-member are said to be positively skewed;
samples weighted toward the fine end are said to be negatively skewed (Fig. 3.8).