

50
3 PARTICLES, PORES, AND PERMEABILITY
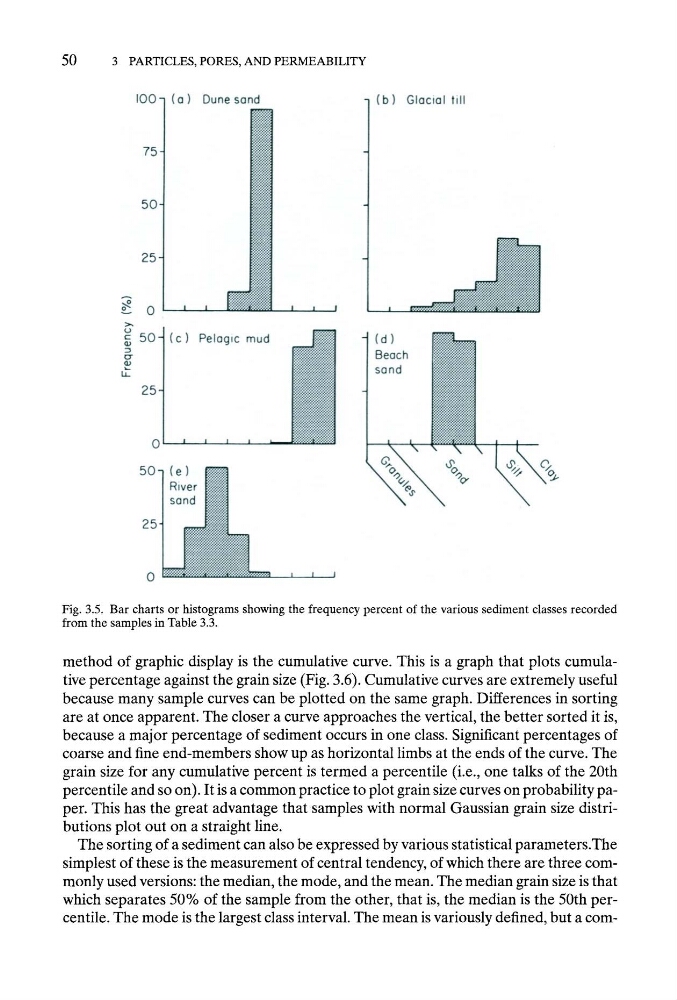
Fig. 3.5. Bar charts or histograms showing the frequency percent of the various sediment classes recorded
from the samples in Table 3.3.
method of graphic display is the cumulative curve. This is a graph that plots cumulative percentage against the grain size (Fig. 3.6). Cumulative curves are extremely useful
because many sample curves can be plotted on the same graph. Differences in sorting
are at once apparent. The closer a curve approaches the vertical, the better sorted it is,
because a major percentage of sediment occurs in one class. Significant percentages of
coarse and fine end-members show up as horizontal limbs at the ends of the curve. The
grain size for any cumulative percent is termed a percentile (i.e., one talks of the 20th
percentile and so on). It is a common practice to plot grain size curves on probability paper. This has the great advantage that samples with normal Gaussian grain size distributions plot out on a straight line.
The sorting of a sediment can also be expressed by various statistical parameters.The
simplest of these is the measurement of central tendency, of which there are three commonly used versions: the median, the mode, and the mean. The median grain size is that
which separates 50% of the sample from the other, that is, the median is the 50th percentile. The mode is the largest class interval. The mean is variously defined, but acom-
3 PARTICLES, PORES, AND PERMEABILITY
Fig. 3.5. Bar charts or histograms showing the frequency percent of the various sediment classes recorded
from the samples in Table 3.3.
method of graphic display is the cumulative curve. This is a graph that plots cumulative percentage against the grain size (Fig. 3.6). Cumulative curves are extremely useful
because many sample curves can be plotted on the same graph. Differences in sorting
are at once apparent. The closer a curve approaches the vertical, the better sorted it is,
because a major percentage of sediment occurs in one class. Significant percentages of
coarse and fine end-members show up as horizontal limbs at the ends of the curve. The
grain size for any cumulative percent is termed a percentile (i.e., one talks of the 20th
percentile and so on). It is a common practice to plot grain size curves on probability paper. This has the great advantage that samples with normal Gaussian grain size distributions plot out on a straight line.
The sorting of a sediment can also be expressed by various statistical parameters.The
simplest of these is the measurement of central tendency, of which there are three commonly used versions: the median, the mode, and the mean. The median grain size is that
which separates 50% of the sample from the other, that is, the median is the 50th percentile. The mode is the largest class interval. The mean is variously defined, but acom-