

52
3 PARTICLES, PORES, AND PERMEABILITY
Coarse
Leptokurtic
Normal
Fine
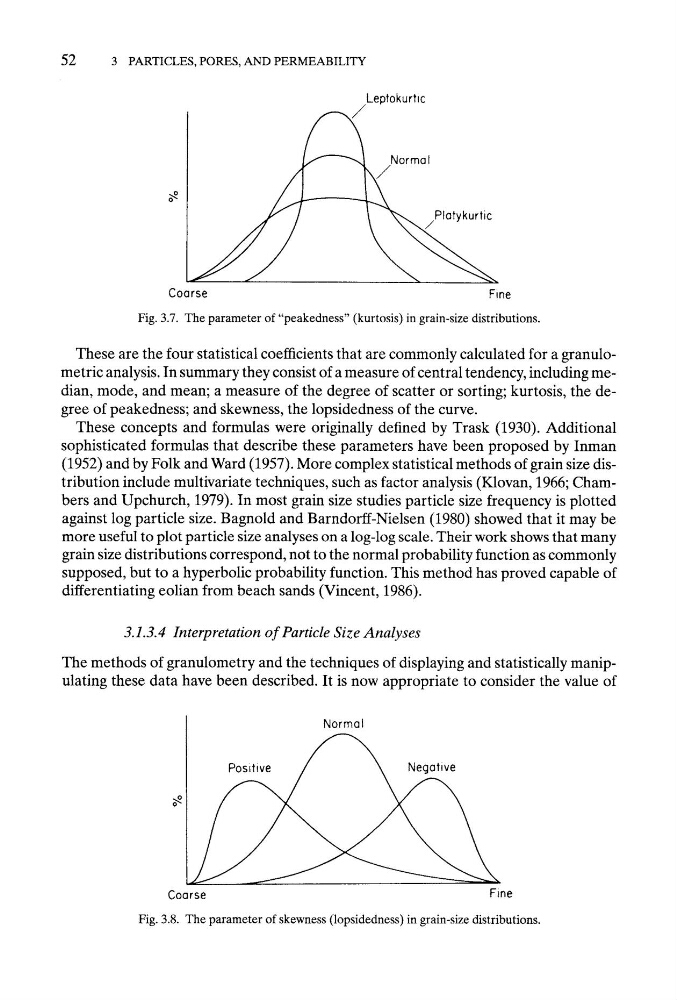
Fig. 3.7. The parameter of "peakedness" (kurtosis) in grain-size distributions.
These are the four statistical coefficients that are commonly calculated for a granulometric analysis. In summary they consist of a measure of central tendency, including median, mode, and mean; a measure of the degree of scatter or sorting; kurtosis, the degree of peakedness; and skewness, the lopsidedness of the curve.
These concepts and formulas were originally defined by Trask (1930). Additional
sophisticated formulas that describe these parameters have been proposed by Inman
(1952) and by Folk and Ward (1957). More complex statistical methods of grain size distribution include multivariate techniques, such as factor analysis (Klovan, 1966; Chambers and Upchurch, 1979). In most grain size studies particle size frequency is plotted
against log particle size. Bagnold and Barndorff-Nielsen (1980) showed that it may be
more useful to plot particle size analyses on a log-log scale. Their work shows that many
grain size distributions correspond, not to the normal probability function as commonly
supposed, but to a hyperbolic probability function. This method has proved capable of
differentiating eolian from beach sands (Vincent, 1986).
3.1.3.4 Interpretation of Particle Size Analyses
The methods of granulometry and the techniques of displaying and statistically manipulating these data have been described. It is now appropriate to consider the value of
Coarse
Normal
9
.
Fine
Fig. 3.8. The parameter of skewness (lopsidedness) in grain-size distributions.
3 PARTICLES, PORES, AND PERMEABILITY
Coarse
Leptokurtic
Normal
Fine
Fig. 3.7. The parameter of "peakedness" (kurtosis) in grain-size distributions.
These are the four statistical coefficients that are commonly calculated for a granulometric analysis. In summary they consist of a measure of central tendency, including median, mode, and mean; a measure of the degree of scatter or sorting; kurtosis, the degree of peakedness; and skewness, the lopsidedness of the curve.
These concepts and formulas were originally defined by Trask (1930). Additional
sophisticated formulas that describe these parameters have been proposed by Inman
(1952) and by Folk and Ward (1957). More complex statistical methods of grain size distribution include multivariate techniques, such as factor analysis (Klovan, 1966; Chambers and Upchurch, 1979). In most grain size studies particle size frequency is plotted
against log particle size. Bagnold and Barndorff-Nielsen (1980) showed that it may be
more useful to plot particle size analyses on a log-log scale. Their work shows that many
grain size distributions correspond, not to the normal probability function as commonly
supposed, but to a hyperbolic probability function. This method has proved capable of
differentiating eolian from beach sands (Vincent, 1986).
3.1.3.4 Interpretation of Particle Size Analyses
The methods of granulometry and the techniques of displaying and statistically manipulating these data have been described. It is now appropriate to consider the value of
Coarse
Normal
9
.
Fine
Fig. 3.8. The parameter of skewness (lopsidedness) in grain-size distributions.