

Mn=lO0
Gs
M
M I00
75
50
25
0 Gu
-Increasing chemical maturity(Mc)
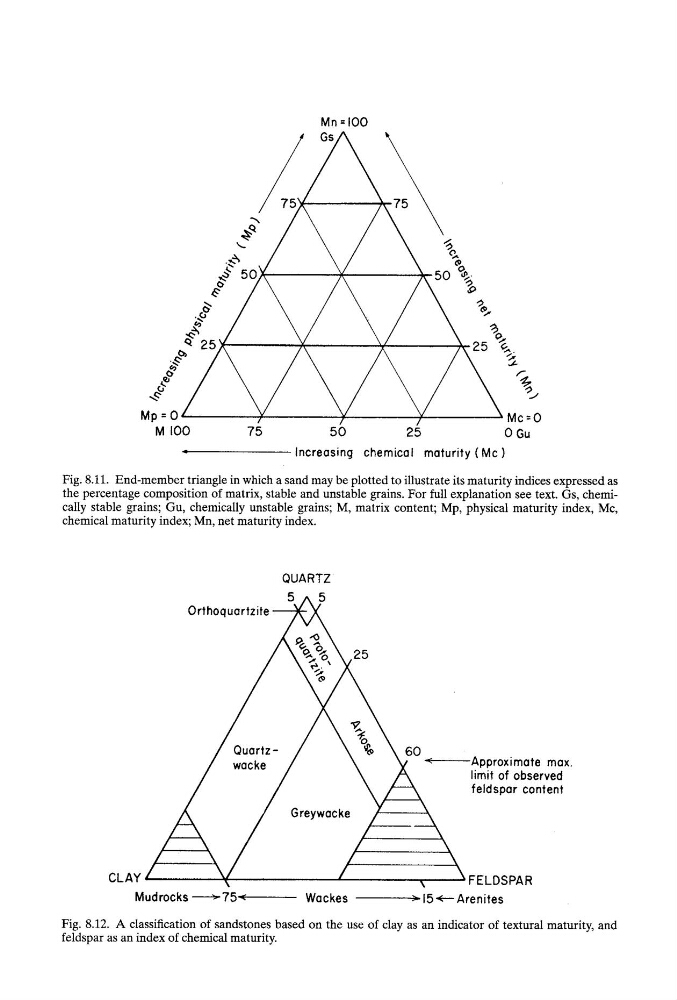
Fig. 8.11. End-member triangle in which a sand may be plotted to illustrate its maturity indices expressed as
the percentage composition of matrix, stable and unstable grains. For full explanation see text. Gs, chemically stable grains; Gu, chemically unstable grains; M, matrix content; Mp, physical maturity index, Mc,
chemical maturity index; Mn, net maturity index.
QUARTZ
Orthoquartzite
5~
25
60
-
Z
CLAY
\
Mudrocks ~'75-<
Wackes
Approximate max.
limit of observed
feldspar content
FELDSPAR
15 ~-- Arenites
Fig. 8.12. A classification of sandstones based on the use of clay as an indicator of textural maturity, and
feldspar as an index of chemical maturity.
Gs
M
M I00
75
50
25
0 Gu
-Increasing chemical maturity(Mc)
Fig. 8.11. End-member triangle in which a sand may be plotted to illustrate its maturity indices expressed as
the percentage composition of matrix, stable and unstable grains. For full explanation see text. Gs, chemically stable grains; Gu, chemically unstable grains; M, matrix content; Mp, physical maturity index, Mc,
chemical maturity index; Mn, net maturity index.
QUARTZ
Orthoquartzite
5~
25
60
-
Z
CLAY
\
Mudrocks ~'75-<
Wackes
Approximate max.
limit of observed
feldspar content
FELDSPAR
15 ~-- Arenites
Fig. 8.12. A classification of sandstones based on the use of clay as an indicator of textural maturity, and
feldspar as an index of chemical maturity.