

21
somewhat, but basal area remained the same or increased a little. Both density and
basal area of C. laevigata were similar to values reported for the oldest communities
sampled 20 years previously and similar to the mature communities that we sampled earlier (data not shown).
In addition to the studies presented above to demonstrate secondary succession
in these woody legume communities, we also used DCA community ordination.
Community age and DCA axis 1 positions were highly correlated with either total
density or total basal area ( r = −0.95, P ≤ 0.0001 and r = −0.97, P ≤ 0.0001, respectively). Moreover, as the plant communities were resampled, new soil samples were
collected and analyzed from the communities in the proposed chronosequence
(Bush 2008 ). Total soil carbon and nitrogen continued to increase in these successional communities. Total soil carbon increased from about 30 g/kg to about 60 g/
kg in the now 52-year-old successional communities. Total soil nitrogen increased
from approximately 3 g/kg to approximately 5 g/kg. When all of the total soil carbon values including the mature community values (>150-year-old communities)
were regressed on time, a quadratic function explained most of the variation. The
R
2 = 0.64 with a P ≥ 0.0001 further confi rming the successional sequence. The same
was true for total nitrogen. The R
2 = 0.70 with a P ≥ 0.0001, again confi rming the
successional sequence.
Besides the increasing levels of total soil carbon and nitrogen, identifi ed in our
earlier studies, in 1983, we found differences between total soil carbon and nitrogen
below the canopies of the 15-year encroachment or post-agricultural abandoned
grassland or savanna with a few V. farnesiana trees and in the intervening intercanopy gaps or patches. Approximate mean value for total soil carbon was 12 g/kg in the
intercanopy and 22 g/kg below the canopy. The approximate mean values for total
soil nitrogen were 1.4 g/kg in the intercanopy gap and 2.5 g/kg below the canopy.
0
20
40
60
80
100
120
5 19 27 39 47 52
RELATIVE BASAL AREA
SUCCESSIONAL TIME-YRS
VACHELLIA
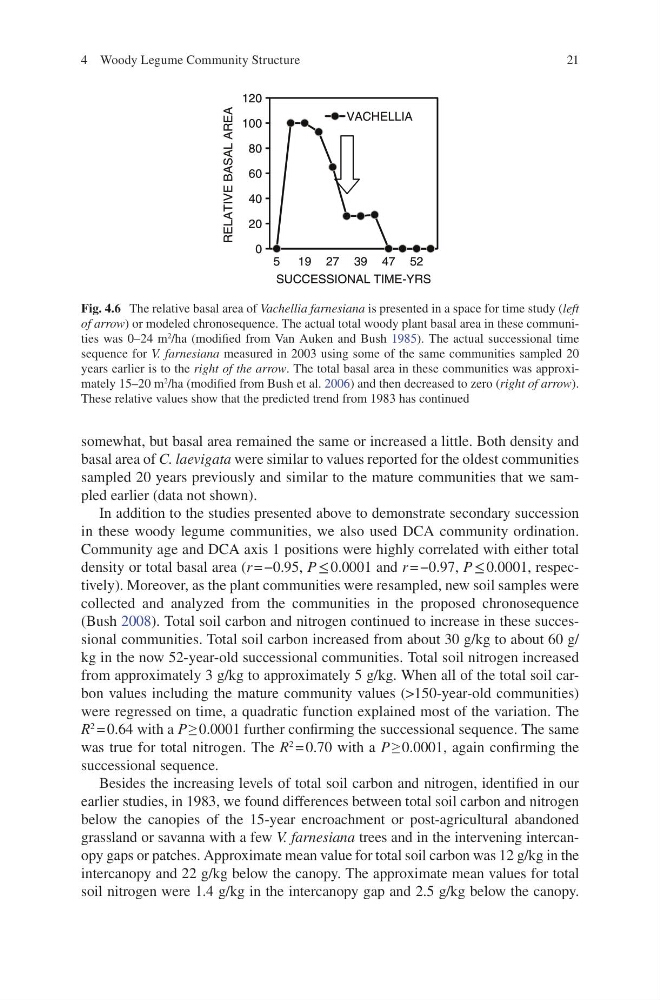
Fig. 4.6 The relative basal area of Vachellia farnesiana is presented in a space for time study ( left
of arrow ) or modeled chronosequence. The actual total woody plant basal area in these communities was 0–24 m
2 /ha (modifi ed from Van Auken and Bush 1985 ). The actual successional time
sequence for V. farnesiana measured in 2003 using some of the same communities sampled 20
years earlier is to the right of the arrow . The total basal area in these communities was approximately 15–20 m
2 /ha (modifi ed from Bush et al. 2006 ) and then decreased to zero ( right of arrow ).
These relative values show that the predicted trend from 1983 has continued
4 Woody Legume Community Structure
somewhat, but basal area remained the same or increased a little. Both density and
basal area of C. laevigata were similar to values reported for the oldest communities
sampled 20 years previously and similar to the mature communities that we sampled earlier (data not shown).
In addition to the studies presented above to demonstrate secondary succession
in these woody legume communities, we also used DCA community ordination.
Community age and DCA axis 1 positions were highly correlated with either total
density or total basal area ( r = −0.95, P ≤ 0.0001 and r = −0.97, P ≤ 0.0001, respectively). Moreover, as the plant communities were resampled, new soil samples were
collected and analyzed from the communities in the proposed chronosequence
(Bush 2008 ). Total soil carbon and nitrogen continued to increase in these successional communities. Total soil carbon increased from about 30 g/kg to about 60 g/
kg in the now 52-year-old successional communities. Total soil nitrogen increased
from approximately 3 g/kg to approximately 5 g/kg. When all of the total soil carbon values including the mature community values (>150-year-old communities)
were regressed on time, a quadratic function explained most of the variation. The
R
2 = 0.64 with a P ≥ 0.0001 further confi rming the successional sequence. The same
was true for total nitrogen. The R
2 = 0.70 with a P ≥ 0.0001, again confi rming the
successional sequence.
Besides the increasing levels of total soil carbon and nitrogen, identifi ed in our
earlier studies, in 1983, we found differences between total soil carbon and nitrogen
below the canopies of the 15-year encroachment or post-agricultural abandoned
grassland or savanna with a few V. farnesiana trees and in the intervening intercanopy gaps or patches. Approximate mean value for total soil carbon was 12 g/kg in the
intercanopy and 22 g/kg below the canopy. The approximate mean values for total
soil nitrogen were 1.4 g/kg in the intercanopy gap and 2.5 g/kg below the canopy.
0
20
40
60
80
100
120
5 19 27 39 47 52
RELATIVE BASAL AREA
SUCCESSIONAL TIME-YRS
VACHELLIA
Fig. 4.6 The relative basal area of Vachellia farnesiana is presented in a space for time study ( left
of arrow ) or modeled chronosequence. The actual total woody plant basal area in these communities was 0–24 m
2 /ha (modifi ed from Van Auken and Bush 1985 ). The actual successional time
sequence for V. farnesiana measured in 2003 using some of the same communities sampled 20
years earlier is to the right of the arrow . The total basal area in these communities was approximately 15–20 m
2 /ha (modifi ed from Bush et al. 2006 ) and then decreased to zero ( right of arrow ).
These relative values show that the predicted trend from 1983 has continued
4 Woody Legume Community Structure