

20
arid grasslands. They are considered space for time studies, and the successional
stages in time are represented by community gradients in space (Begon et al. 2006 ).
They are usually coupled with the use of various maps, including soil survey maps,
aerial photographs, interviews with residents, and possibly dendrochronological or
tree coring studies which are all tools that we used (Van Auken and Bush 1985 ).
After 20 years, we revisited some of these communities and demonstrated that
the proposed encroachment and secondary succession based on space for time sampling and modeling have been confi rmed as a true chronosequence of secondary
succession that was based on temporal studies (Bush et al. 2006 ). In our fi rst study
(Van Auken and Bush 1985 ), we showed that total density of woody plants increased
from zero to approximately 2,000 plants/ha and that total basal area of the woody
plants increased from zero to approximately 20 m
2
/ha (data not shown). The two
dominant species in the chronosequence, V. farnesiana, the proposed encroaching
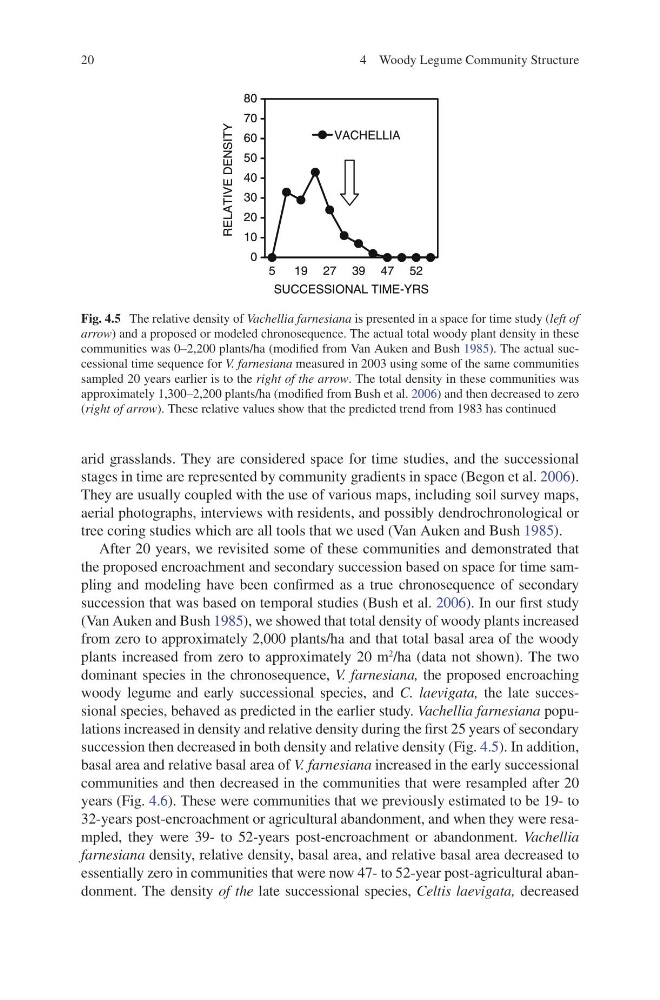
woody legume and early successional species, and C. laevigata, the late successional species, behaved as predicted in the earlier study. Vachellia farnesiana populations increased in density and relative density during the fi rst 25 years of secondary
succession then decreased in both density and relative density (Fig. 4.5 ). In addition,
basal area and relative basal area of V. farnesiana increased in the early successional
communities and then decreased in the communities that were resampled after 20
years (Fig. 4.6 ). These were communities that we previously estimated to be 19- to
32-years post-encroachment or agricultural abandonment, and when they were resampled, they were 39- to 52-years post-encroachment or abandonment. Vachellia
farnesiana density, relative density, basal area, and relative basal area decreased to
essentially zero in communities that were now 47- to 52-year post- agricultural abandonment. The density of the late successional species, Celtis laevigata, decreased
0
10
20
30
40
50
60
70
80
5
19 27 39 47 52
RELATIVE DENSITY
SUCCESSIONAL TIME-YRS
VACHELLIA
Fig. 4.5 The relative density of Vachellia farnesiana is presented in a space for time study ( left of
arrow ) and a proposed or modeled chronosequence. The actual total woody plant density in these
communities was 0–2,200 plants/ha (modifi ed from Van Auken and Bush 1985 ). The actual successional time sequence for V. farnesiana measured in 2003 using some of the same communities
sampled 20 years earlier is to the right of the arrow . The total density in these communities was
approximately 1,300–2,200 plants/ha (modifi ed from Bush et al. 2006 ) and then decreased to zero
( right of arrow ). These relative values show that the predicted trend from 1983 has continued
4 Woody Legume Community Structure
arid grasslands. They are considered space for time studies, and the successional
stages in time are represented by community gradients in space (Begon et al. 2006 ).
They are usually coupled with the use of various maps, including soil survey maps,
aerial photographs, interviews with residents, and possibly dendrochronological or
tree coring studies which are all tools that we used (Van Auken and Bush 1985 ).
After 20 years, we revisited some of these communities and demonstrated that
the proposed encroachment and secondary succession based on space for time sampling and modeling have been confi rmed as a true chronosequence of secondary
succession that was based on temporal studies (Bush et al. 2006 ). In our fi rst study
(Van Auken and Bush 1985 ), we showed that total density of woody plants increased
from zero to approximately 2,000 plants/ha and that total basal area of the woody
plants increased from zero to approximately 20 m
2
/ha (data not shown). The two
dominant species in the chronosequence, V. farnesiana, the proposed encroaching
woody legume and early successional species, and C. laevigata, the late successional species, behaved as predicted in the earlier study. Vachellia farnesiana populations increased in density and relative density during the fi rst 25 years of secondary
succession then decreased in both density and relative density (Fig. 4.5 ). In addition,
basal area and relative basal area of V. farnesiana increased in the early successional
communities and then decreased in the communities that were resampled after 20
years (Fig. 4.6 ). These were communities that we previously estimated to be 19- to
32-years post-encroachment or agricultural abandonment, and when they were resampled, they were 39- to 52-years post-encroachment or abandonment. Vachellia
farnesiana density, relative density, basal area, and relative basal area decreased to
essentially zero in communities that were now 47- to 52-year post- agricultural abandonment. The density of the late successional species, Celtis laevigata, decreased
0
10
20
30
40
50
60
70
80
5
19 27 39 47 52
RELATIVE DENSITY
SUCCESSIONAL TIME-YRS
VACHELLIA
Fig. 4.5 The relative density of Vachellia farnesiana is presented in a space for time study ( left of
arrow ) and a proposed or modeled chronosequence. The actual total woody plant density in these
communities was 0–2,200 plants/ha (modifi ed from Van Auken and Bush 1985 ). The actual successional time sequence for V. farnesiana measured in 2003 using some of the same communities
sampled 20 years earlier is to the right of the arrow . The total density in these communities was
approximately 1,300–2,200 plants/ha (modifi ed from Bush et al. 2006 ) and then decreased to zero
( right of arrow ). These relative values show that the predicted trend from 1983 has continued
4 Woody Legume Community Structure