

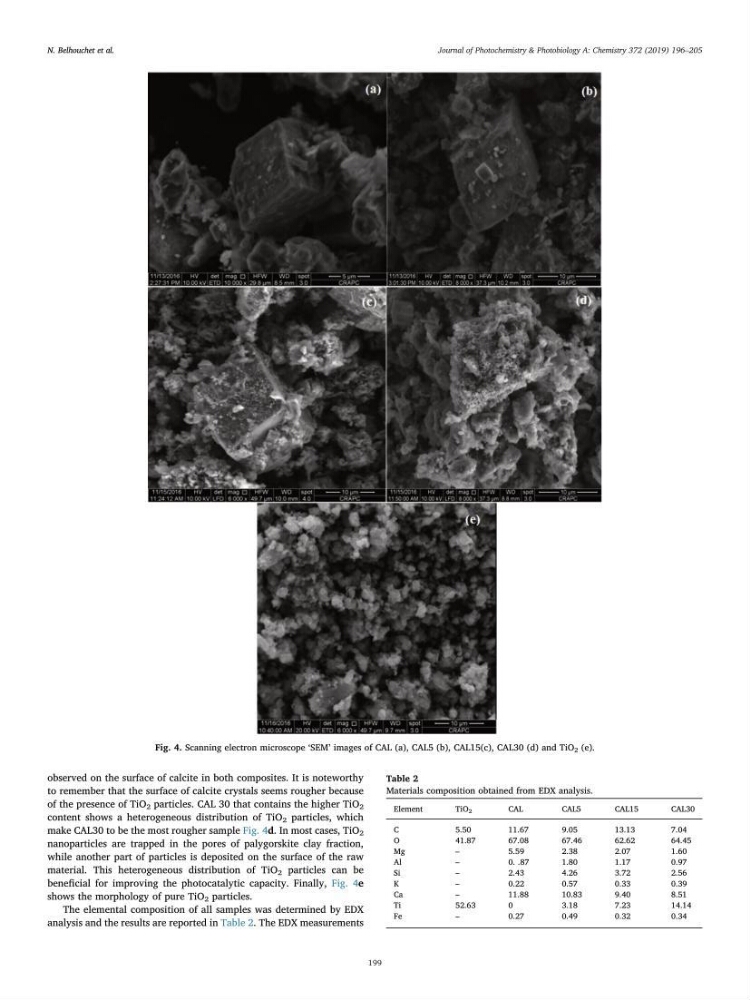
observed on the surface of calcite in both composites. It is noteworthy
to remember that the surface of calcite crystals seems rougher because
of the presence of TiO 2 particles. CAL 30 that contains the higher TiO 2
content shows a heterogeneous distribution of TiO 2 particles, which
make CAL30 to be the most rougher sample Fig. 4d. In most cases, TiO 2
nanoparticles are trapped in the pores of palygorskite clay fraction,
while another part of particles is deposited on the surface of the raw
material. This heterogeneous distribution of TiO 2 particles can be
beneficial for improving the photocatalytic capacity. Finally, Fig. 4e
shows the morphology of pure TiO 2 particles.
The elemental composition of all samples was determined by EDX
analysis and the results are reported in Table 2. The EDX measurements
Fig. 4. Scanning electron microscope ‘SEM’ images of CAL (a), CAL5 (b), CAL15(c), CAL30 (d) and TiO 2 (e).
Table 2
Materials composition obtained from EDX analysis.
Element
TiO 2
CAL
CAL5
CAL15
CAL30
C
5.50
11.67
9.05
13.13
7.04
O
41.87
67.08
67.46
62.62
64.45
Mg
–
5.59
2.38
2.07
1.60
Al
–
0. .87
1.80
1.17
0.97
Si
–
2.43
4.26
3.72
2.56
K
–
0.22
0.57
0.33
0.39
Ca
–
11.88
10.83
9.40
8.51
Ti
52.63
0
3.18
7.23
14.14
Fe
–
0.27
0.49
0.32
0.34
N. Belhouchet et al.
Journal of Photochemistry & Photobiology A: Chemistry 372 (2019) 196–205
199
to remember that the surface of calcite crystals seems rougher because
of the presence of TiO 2 particles. CAL 30 that contains the higher TiO 2
content shows a heterogeneous distribution of TiO 2 particles, which
make CAL30 to be the most rougher sample Fig. 4d. In most cases, TiO 2
nanoparticles are trapped in the pores of palygorskite clay fraction,
while another part of particles is deposited on the surface of the raw
material. This heterogeneous distribution of TiO 2 particles can be
beneficial for improving the photocatalytic capacity. Finally, Fig. 4e
shows the morphology of pure TiO 2 particles.
The elemental composition of all samples was determined by EDX
analysis and the results are reported in Table 2. The EDX measurements
Fig. 4. Scanning electron microscope ‘SEM’ images of CAL (a), CAL5 (b), CAL15(c), CAL30 (d) and TiO 2 (e).
Table 2
Materials composition obtained from EDX analysis.
Element
TiO 2
CAL
CAL5
CAL15
CAL30
C
5.50
11.67
9.05
13.13
7.04
O
41.87
67.08
67.46
62.62
64.45
Mg
–
5.59
2.38
2.07
1.60
Al
–
0. .87
1.80
1.17
0.97
Si
–
2.43
4.26
3.72
2.56
K
–
0.22
0.57
0.33
0.39
Ca
–
11.88
10.83
9.40
8.51
Ti
52.63
0
3.18
7.23
14.14
Fe
–
0.27
0.49
0.32
0.34
N. Belhouchet et al.
Journal of Photochemistry & Photobiology A: Chemistry 372 (2019) 196–205
199