

55
22.1. Actor profiling:
As mentioned earlier in this chapter, in the fifth stage we perform a bivariate ranking of actors
using R i , and NS with a two parameters filter on Microsoft EXCEL software to define the
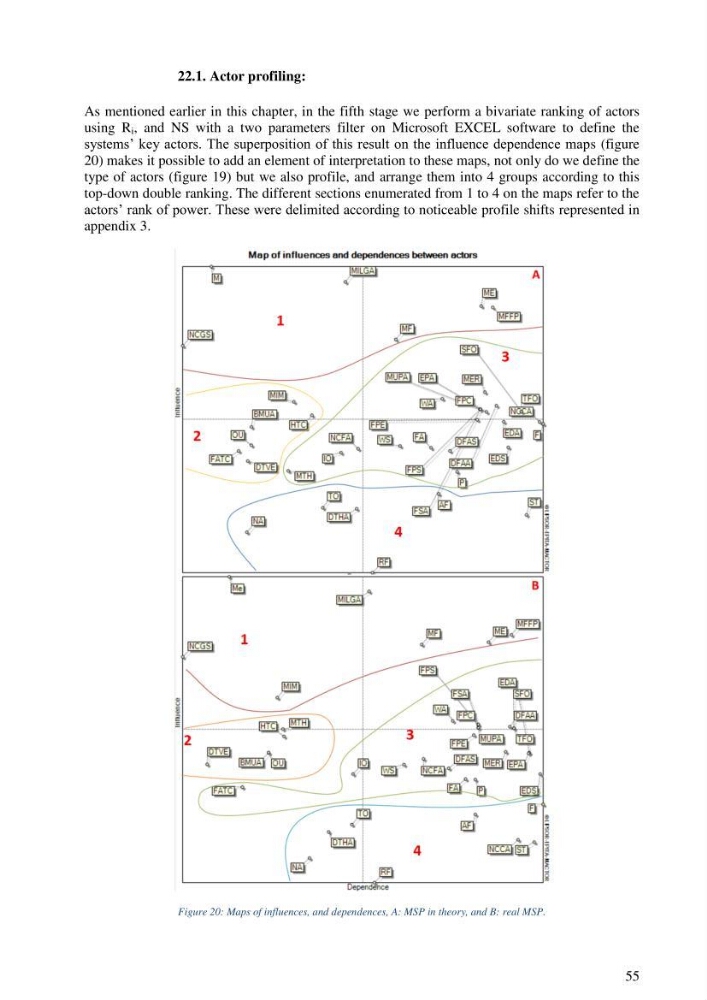
systems‟ key actors. The superposition of this result on the influence dependence maps (figure
20) makes it possible to add an element of interpretation to these maps, not only do we define the
type of actors (figure 19) but we also profile, and arrange them into 4 groups according to this
top-down double ranking. The different sections enumerated from 1 to 4 on the maps refer to the
actors‟ rank of power. These were delimited according to noticeable profile shifts represented in
appendix 3.
Figure 20: Maps of influences, and dependences, A: MSP in theory, and B: real MSP.
22.1. Actor profiling:
As mentioned earlier in this chapter, in the fifth stage we perform a bivariate ranking of actors
using R i , and NS with a two parameters filter on Microsoft EXCEL software to define the
systems‟ key actors. The superposition of this result on the influence dependence maps (figure
20) makes it possible to add an element of interpretation to these maps, not only do we define the
type of actors (figure 19) but we also profile, and arrange them into 4 groups according to this
top-down double ranking. The different sections enumerated from 1 to 4 on the maps refer to the
actors‟ rank of power. These were delimited according to noticeable profile shifts represented in
appendix 3.
Figure 20: Maps of influences, and dependences, A: MSP in theory, and B: real MSP.