

54
2.2. Map of influences and dependences between actors
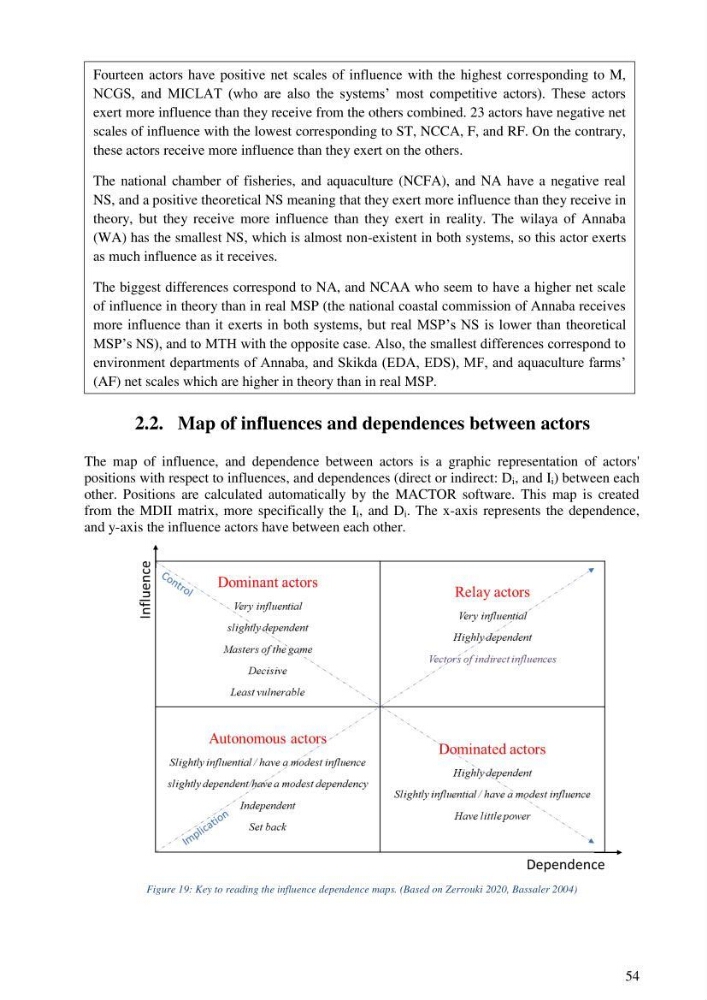
The map of influence, and dependence between actors is a graphic representation of actors'
positions with respect to influences, and dependences (direct or indirect: D i , and I i ) between each
other. Positions are calculated automatically by the MACTOR software. This map is created
from the MDII matrix, more specifically the I i , and D i . The x-axis represents the dependence,
and y-axis the influence actors have between each other.
Figure 19: Key to reading the influence dependence maps. (Based on Zerrouki 2020, Bassaler 2004)
Fourteen actors have positive net scales of influence with the highest corresponding to M,
NCGS, and MICLAT (who are also the systems‟ most competitive actors). These actors
exert more influence than they receive from the others combined. 23 actors have negative net
scales of influence with the lowest corresponding to ST, NCCA, F, and RF. On the contrary,
these actors receive more influence than they exert on the others.
The national chamber of fisheries, and aquaculture (NCFA), and NA have a negative real
NS, and a positive theoretical NS meaning that they exert more influence than they receive in
theory, but they receive more influence than they exert in reality. The wilaya of Annaba
(WA) has the smallest NS, which is almost non-existent in both systems, so this actor exerts
as much influence as it receives.
The biggest differences correspond to NA, and NCAA who seem to have a higher net scale
of influence in theory than in real MSP (the national coastal commission of Annaba receives
more influence than it exerts in both systems, but real MSP‟s NS is lower than theoretical
MSP‟s NS), and to MTH with the opposite case. Also, the smallest differences correspond to
environment departments of Annaba, and Skikda (EDA, EDS), MF, and aquaculture farms‟
(AF) net scales which are higher in theory than in real MSP.
2.2. Map of influences and dependences between actors
The map of influence, and dependence between actors is a graphic representation of actors'
positions with respect to influences, and dependences (direct or indirect: D i , and I i ) between each
other. Positions are calculated automatically by the MACTOR software. This map is created
from the MDII matrix, more specifically the I i , and D i . The x-axis represents the dependence,
and y-axis the influence actors have between each other.
Figure 19: Key to reading the influence dependence maps. (Based on Zerrouki 2020, Bassaler 2004)
Fourteen actors have positive net scales of influence with the highest corresponding to M,
NCGS, and MICLAT (who are also the systems‟ most competitive actors). These actors
exert more influence than they receive from the others combined. 23 actors have negative net
scales of influence with the lowest corresponding to ST, NCCA, F, and RF. On the contrary,
these actors receive more influence than they exert on the others.
The national chamber of fisheries, and aquaculture (NCFA), and NA have a negative real
NS, and a positive theoretical NS meaning that they exert more influence than they receive in
theory, but they receive more influence than they exert in reality. The wilaya of Annaba
(WA) has the smallest NS, which is almost non-existent in both systems, so this actor exerts
as much influence as it receives.
The biggest differences correspond to NA, and NCAA who seem to have a higher net scale
of influence in theory than in real MSP (the national coastal commission of Annaba receives
more influence than it exerts in both systems, but real MSP‟s NS is lower than theoretical
MSP‟s NS), and to MTH with the opposite case. Also, the smallest differences correspond to
environment departments of Annaba, and Skikda (EDA, EDS), MF, and aquaculture farms‟
(AF) net scales which are higher in theory than in real MSP.