

where EDI (μg kg
−1 body weight day
−1
) = the estimated daily
intake, FIR = seafood ingestion rate for adults (7
g/capita.day
−1
) (FAOSTAT 2017), Ci ( μg g
−1 w.w) = concentration of the metal in the fish, BW is the average body weight
(72.5 kg for this study) (CREAD 2018).
Few studies are reporting that the cooking process could
reduce the bioavailability of some metal trace (Alves et al.
2018; Liao et al. 2019). However, it is supposed that the
metals were wholly absorbed and that their concentrations
were unaffected by the cooking process (Rasmussen et al.
2017). To determine the health risks and the carcinogenicity
related to the consumption of marine sea bream from Algerian
coastal, the target hazard quotient (THQ) was calculated following the formula below (Copat et al. 2013).
THQ ¼
EF Â ED Â FIR Â Ci
RfD Â BW Â AT
 10−3
EF = the exposure frequency 150 days (for people who eat
fish 3 times a week) (CREAD 2018); ED = the exposure
duration (70 years old) equivalent to the life expectancy at
birth; FIR = the seafood ingestion rate in Algeria (7 g/person/day); Ci = the metal concentration in the sample (μg g
−1
w.w); Rf D (μg g day
−1
) = the oral reference dose: Cd = 1 ×
10
−3
, Cu = 4 × 10
−2
, Zn = 4 × 10
−2
, Pb = 4 × 10
−3
, and As = 3
× 10
−4 (USEPA 2000); BW = the average body weight
(72.5 kg for adults); AT = the average exposure time for
non-carcinogens (AT = EF days/year × ED years).
Furthermore, all arsenic consumption limit calculations were
made assuming that the toxic inorganic arsenic was 10% of
the total (Marengo et al. 2018).
In this present work, the cumulative target hazard quotient
(TTHQ) was calculated by adding the THQ value of each
metal as follows:
TTHQ ¼ ∑
n
i THQi
A THQ < 1 indicates that daily exposure is unexpected to
have any negative effects on human health over a lifetime,
whereas THQ ≥ 1 indicates possible adverse effects
(USEPA 2015).
The lifetime carcinogenic risk of As, Cd, and Pb was calculated following (USEPA 2000) equation.
LCR ¼ CSF Â EDI
where CSF is the carcinogenic slope factor of 0.0085 (mg/kg/
day)
−1
, 1.5 (mg/kg/day)
−1
, and 6.3 (mg/kg/day)
−1 for Pb, As,
and Cd, respectively. EDI is the estimated daily intake of
heavy metals (mg kg
−1 body weight day
−1
). Acceptable risk
levels for carcinogens range are from 10
−4 to 10
−6
; in this
study, we consider 10
−5 the standard point for cancer.
Data analysis
Non-parametric test statistics were applied to check the significance of differences between the two groups (wild and
y = 0.0257x + 15.816
22
23
24
25
26
27
28
280
290
300
310
320
330
340
350
360
370
lenght (cm)
weight (g)
Régression de lenght (cm) par weight (g)-Raceway- (R²=0,769)
y = 0.0289x + 15.944
24
24.5
25
25.5
26
26.5
27
300
310
320
330
340
350
360
370
lenght (cm)
weight (g)
Régression de lenght (cm) par weight (g)-Floating
cage- (R²=0,868)
y = 0.046x + 12.979
15
20
25
30
35
40
150
200
250
300
350
400
450
500
lenght (cm)
weight (g)
Régression de lenght (cm) par weight (g)-Wild- (R²=0,814)
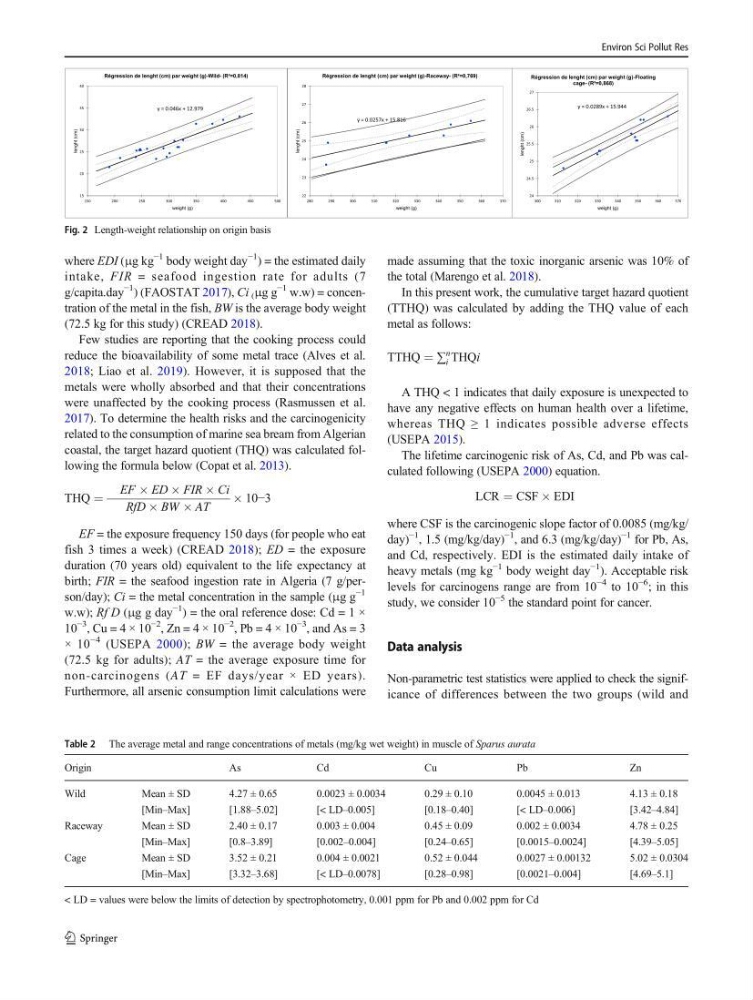
Fig. 2 Length-weight relationship on origin basis
Table 2 The average metal and range concentrations of metals (mg/kg wet weight) in muscle of Sparus aurata
Origin
As
Cd
Cu
Pb
Zn
Wild
Mean ± SD
4.27 ± 0.65
0.0023 ± 0.0034
0.29 ± 0.10
0.0045 ± 0.013
4.13 ± 0.18
[Min–Max]
[1.88–5.02]
[< LD–0.005]
[0.18–0.40]
[< LD–0.006]
[3.42–4.84]
Raceway
Mean ± SD
2.40 ± 0.17
0.003 ± 0.004
0.45 ± 0.09
0.002 ± 0.0034
4.78 ± 0.25
[Min–Max]
[0.8–3.89]
[0.002–0.004]
[0.24–0.65]
[0.0015–0.0024]
[4.39–5.05]
Cage
Mean ± SD
3.52 ± 0.21
0.004 ± 0.0021
0.52 ± 0.044
0.0027 ± 0.00132
5.02 ± 0.0304
[Min–Max]
[3.32–3.68]
[< LD–0.0078]
[0.28–0.98]
[0.0021–0.004]
[4.69–5.1]
< LD = values were below the limits of detection by spectrophotometry, 0.001 ppm for Pb and 0.002 ppm for Cd
Environ Sci Pollut Res
−1 body weight day
−1
) = the estimated daily
intake, FIR = seafood ingestion rate for adults (7
g/capita.day
−1
) (FAOSTAT 2017), Ci ( μg g
−1 w.w) = concentration of the metal in the fish, BW is the average body weight
(72.5 kg for this study) (CREAD 2018).
Few studies are reporting that the cooking process could
reduce the bioavailability of some metal trace (Alves et al.
2018; Liao et al. 2019). However, it is supposed that the
metals were wholly absorbed and that their concentrations
were unaffected by the cooking process (Rasmussen et al.
2017). To determine the health risks and the carcinogenicity
related to the consumption of marine sea bream from Algerian
coastal, the target hazard quotient (THQ) was calculated following the formula below (Copat et al. 2013).
THQ ¼
EF Â ED Â FIR Â Ci
RfD Â BW Â AT
 10−3
EF = the exposure frequency 150 days (for people who eat
fish 3 times a week) (CREAD 2018); ED = the exposure
duration (70 years old) equivalent to the life expectancy at
birth; FIR = the seafood ingestion rate in Algeria (7 g/person/day); Ci = the metal concentration in the sample (μg g
−1
w.w); Rf D (μg g day
−1
) = the oral reference dose: Cd = 1 ×
10
−3
, Cu = 4 × 10
−2
, Zn = 4 × 10
−2
, Pb = 4 × 10
−3
, and As = 3
× 10
−4 (USEPA 2000); BW = the average body weight
(72.5 kg for adults); AT = the average exposure time for
non-carcinogens (AT = EF days/year × ED years).
Furthermore, all arsenic consumption limit calculations were
made assuming that the toxic inorganic arsenic was 10% of
the total (Marengo et al. 2018).
In this present work, the cumulative target hazard quotient
(TTHQ) was calculated by adding the THQ value of each
metal as follows:
TTHQ ¼ ∑
n
i THQi
A THQ < 1 indicates that daily exposure is unexpected to
have any negative effects on human health over a lifetime,
whereas THQ ≥ 1 indicates possible adverse effects
(USEPA 2015).
The lifetime carcinogenic risk of As, Cd, and Pb was calculated following (USEPA 2000) equation.
LCR ¼ CSF Â EDI
where CSF is the carcinogenic slope factor of 0.0085 (mg/kg/
day)
−1
, 1.5 (mg/kg/day)
−1
, and 6.3 (mg/kg/day)
−1 for Pb, As,
and Cd, respectively. EDI is the estimated daily intake of
heavy metals (mg kg
−1 body weight day
−1
). Acceptable risk
levels for carcinogens range are from 10
−4 to 10
−6
; in this
study, we consider 10
−5 the standard point for cancer.
Data analysis
Non-parametric test statistics were applied to check the significance of differences between the two groups (wild and
y = 0.0257x + 15.816
22
23
24
25
26
27
28
280
290
300
310
320
330
340
350
360
370
lenght (cm)
weight (g)
Régression de lenght (cm) par weight (g)-Raceway- (R²=0,769)
y = 0.0289x + 15.944
24
24.5
25
25.5
26
26.5
27
300
310
320
330
340
350
360
370
lenght (cm)
weight (g)
Régression de lenght (cm) par weight (g)-Floating
cage- (R²=0,868)
y = 0.046x + 12.979
15
20
25
30
35
40
150
200
250
300
350
400
450
500
lenght (cm)
weight (g)
Régression de lenght (cm) par weight (g)-Wild- (R²=0,814)
Fig. 2 Length-weight relationship on origin basis
Table 2 The average metal and range concentrations of metals (mg/kg wet weight) in muscle of Sparus aurata
Origin
As
Cd
Cu
Pb
Zn
Wild
Mean ± SD
4.27 ± 0.65
0.0023 ± 0.0034
0.29 ± 0.10
0.0045 ± 0.013
4.13 ± 0.18
[Min–Max]
[1.88–5.02]
[< LD–0.005]
[0.18–0.40]
[< LD–0.006]
[3.42–4.84]
Raceway
Mean ± SD
2.40 ± 0.17
0.003 ± 0.004
0.45 ± 0.09
0.002 ± 0.0034
4.78 ± 0.25
[Min–Max]
[0.8–3.89]
[0.002–0.004]
[0.24–0.65]
[0.0015–0.0024]
[4.39–5.05]
Cage
Mean ± SD
3.52 ± 0.21
0.004 ± 0.0021
0.52 ± 0.044
0.0027 ± 0.00132
5.02 ± 0.0304
[Min–Max]
[3.32–3.68]
[< LD–0.0078]
[0.28–0.98]
[0.0021–0.004]
[4.69–5.1]
< LD = values were below the limits of detection by spectrophotometry, 0.001 ppm for Pb and 0.002 ppm for Cd
Environ Sci Pollut Res