

combined toxic substances (Jamshidi and Bastami 2016). It can be used to
identify and categorize areas of potential risk in terms of sediment quality (Lin
et al. 2018). Toxicity probability for the biota was defined depending on the
value of MERM-Q; in our study mean ERM-Q ranged between 9% and 21%.
The fish farming area could therefore be classified as a low-priority site for
monitoring programs. In brief, it is unlikely that Cu, Zn, Pb, and Cd would
have adverse effects on the local ecosystem in Azeffoun fish farm.
Mainly source and origin of heavy metals
Principal component analysis (PCA) was conducted to identify potential
sources of metals in sediments. It is a useful tool for determining control
processes in a complex data set and to reveal similarities and differences
(Ogunlaja et al. 2019). The validity of the model was verified, and eigenvalues
> 0.57 were considered as criteria for the extraction of the principal components (Figure 4). To interpret the selected components, Kaiser Standardization
was applied.
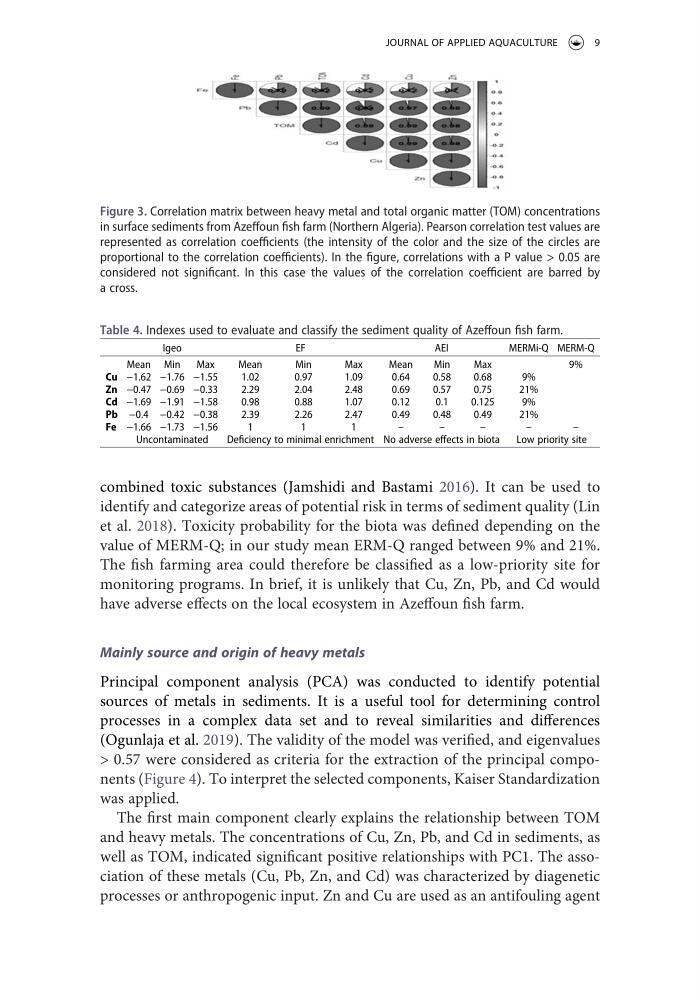
The first main component clearly explains the relationship between TOM
and heavy metals. The concentrations of Cu, Zn, Pb, and Cd in sediments, as
well as TOM, indicated significant positive relationships with PC1. The association of these metals (Cu, Pb, Zn, and Cd) was characterized by diagenetic
processes or anthropogenic input. Zn and Cu are used as an antifouling agent
Figure 3. Correlation matrix between heavy metal and total organic matter (TOM) concentrations
in surface sediments from Azeffoun fish farm (Northern Algeria). Pearson correlation test values are
represented as correlation coefficients (the intensity of the color and the size of the circles are
proportional to the correlation coefficients). In the figure, correlations with a P value > 0.05 are
considered not significant. In this case the values of the correlation coefficient are barred by
a cross.
Table 4. Indexes used to evaluate and classify the sediment quality of Azeffoun fish farm.
Igeo
EF
AEI
MERMi-Q MERM-Q
Mean Min Max
Mean
Min
Max
Mean
Min
Max
9%
Cu −1.62 −1.76 −1.55
1.02
0.97
1.09
0.64
0.58
0.68
9%
Zn −0.47 −0.69 −0.33
2.29
2.04
2.48
0.69
0.57
0.75
21%
Cd −1.69 −1.91 −1.58
0.98
0.88
1.07
0.12
0.1
0.125
9%
Pb −0.4 −0.42 −0.38
2.39
2.26
2.47
0.49
0.48
0.49
21%
Fe −1.66 −1.73 −1.56
1
1
1
–
–
–
–
–
Uncontaminated
Deficiency to minimal enrichment No adverse effects in biota
Low priority site
JOURNAL OF APPLIED AQUACULTURE
9
identify and categorize areas of potential risk in terms of sediment quality (Lin
et al. 2018). Toxicity probability for the biota was defined depending on the
value of MERM-Q; in our study mean ERM-Q ranged between 9% and 21%.
The fish farming area could therefore be classified as a low-priority site for
monitoring programs. In brief, it is unlikely that Cu, Zn, Pb, and Cd would
have adverse effects on the local ecosystem in Azeffoun fish farm.
Mainly source and origin of heavy metals
Principal component analysis (PCA) was conducted to identify potential
sources of metals in sediments. It is a useful tool for determining control
processes in a complex data set and to reveal similarities and differences
(Ogunlaja et al. 2019). The validity of the model was verified, and eigenvalues
> 0.57 were considered as criteria for the extraction of the principal components (Figure 4). To interpret the selected components, Kaiser Standardization
was applied.
The first main component clearly explains the relationship between TOM
and heavy metals. The concentrations of Cu, Zn, Pb, and Cd in sediments, as
well as TOM, indicated significant positive relationships with PC1. The association of these metals (Cu, Pb, Zn, and Cd) was characterized by diagenetic
processes or anthropogenic input. Zn and Cu are used as an antifouling agent
Figure 3. Correlation matrix between heavy metal and total organic matter (TOM) concentrations
in surface sediments from Azeffoun fish farm (Northern Algeria). Pearson correlation test values are
represented as correlation coefficients (the intensity of the color and the size of the circles are
proportional to the correlation coefficients). In the figure, correlations with a P value > 0.05 are
considered not significant. In this case the values of the correlation coefficient are barred by
a cross.
Table 4. Indexes used to evaluate and classify the sediment quality of Azeffoun fish farm.
Igeo
EF
AEI
MERMi-Q MERM-Q
Mean Min Max
Mean
Min
Max
Mean
Min
Max
9%
Cu −1.62 −1.76 −1.55
1.02
0.97
1.09
0.64
0.58
0.68
9%
Zn −0.47 −0.69 −0.33
2.29
2.04
2.48
0.69
0.57
0.75
21%
Cd −1.69 −1.91 −1.58
0.98
0.88
1.07
0.12
0.1
0.125
9%
Pb −0.4 −0.42 −0.38
2.39
2.26
2.47
0.49
0.48
0.49
21%
Fe −1.66 −1.73 −1.56
1
1
1
–
–
–
–
–
Uncontaminated
Deficiency to minimal enrichment No adverse effects in biota
Low priority site
JOURNAL OF APPLIED AQUACULTURE
9