

Zn (62.00–113.00 mg/Kg), Pb (21.20–23.00 mg/Kg), Cd (0.11–0.15 mg/Kg),
and (TOM) (1.2% to 3.1%) respectively.
The values reported in the fish farm area were significantly higher (P < 0.001)
than those of the reference station. The organic matter content is almost 3 times
the reference site content. It indicates that organic waste is mainly loaded on the
sediment just beneath the fish cages. The highest concentrations of trace metals
Cd, Cu, Fe, Pb, Zn, and organic matter were measured under the fish cages
compared to concentrations in the reference zone. This result was supported by
highly significant intersite ERs (P < 0.01). The lowest concentrations were
recorded at S4 (400 m beyond the fish farm). The concentrations of Zn under
the fish cages and near the fish cages were very high compared with the respective
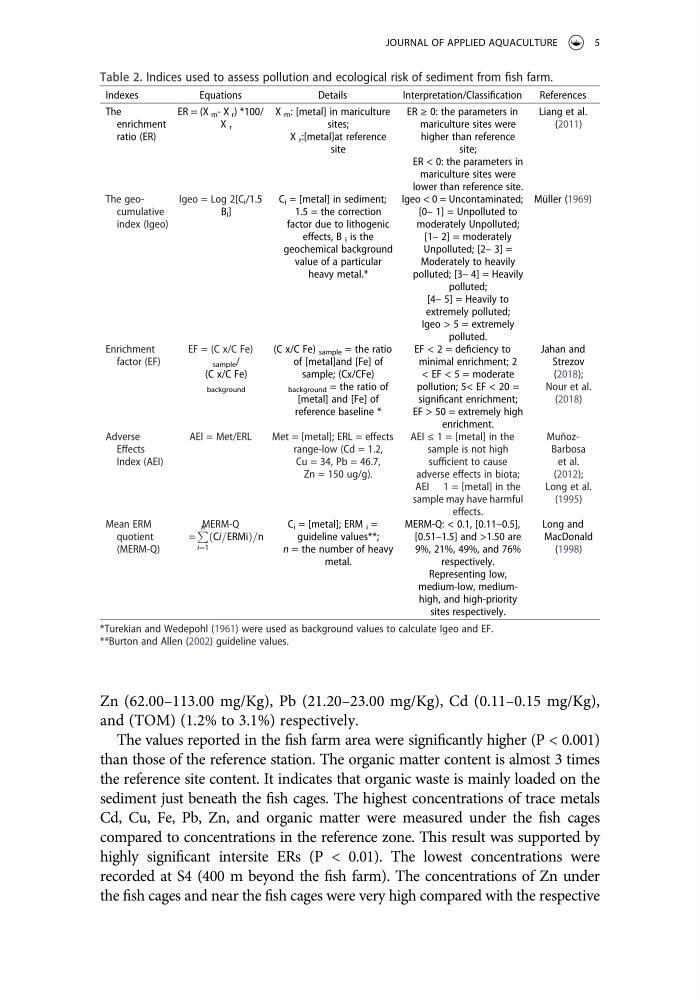
Table 2. Indices used to assess pollution and ecological risk of sediment from fish farm.
Indexes
Equations
Details
Interpretation/Classification
References
The
enrichment
ratio (ER)
ER = (X m - X r ) *100/
X r
X m : [metal] in mariculture
sites;
X r :[metal]at reference
site
ER ≥ 0: the parameters in
mariculture sites were
higher than reference
site;
ER < 0: the parameters in
mariculture sites were
lower than reference site.
Liang et al.
(2011)
The geocumulative
index (Igeo)
Igeo = Log 2[C i /1.5
B i ]
C i = [metal] in sediment;
1.5 = the correction
factor due to lithogenic
effects, B i is the
geochemical background
value of a particular
heavy metal.*
Igeo < 0 = Uncontaminated;
[0– 1] = Unpolluted to
moderately Unpolluted;
[1– 2] = moderately
Unpolluted; [2– 3] =
Moderately to heavily
polluted; [3– 4] = Heavily
polluted;
[4– 5] = Heavily to
extremely polluted;
Igeo > 5 = extremely
polluted.
Müller (1969)
Enrichment
factor (EF)
EF = (C x/C Fe)
sample /
(C x/C Fe)
background
(C x/C Fe) sample = the ratio
of [metal]and [Fe] of
sample; (Cx/CFe)
background = the ratio of
[metal] and [Fe] of
reference baseline *
EF < 2 = deficiency to
minimal enrichment; 2
< EF < 5 = moderate
pollution; 5< EF < 20 =
significant enrichment;
EF > 50 = extremely high
enrichment.
Jahan and
Strezov
(2018);
Nour et al.
(2018)
Adverse
Effects
Index (AEI)
AEI = Met/ERL
Met = [metal]; ERL = effects
range-low (Cd = 1.2,
Cu = 34, Pb = 46.7,
Zn = 150 ug/g).
AEI ≤ 1 = [metal] in the
sample is not high
sufficient to cause
adverse effects in biota;
AEI 1 = [metal] in the
sample may have harmful
effects.
MuñozBarbosa
et al.
(2012);
Long et al.
(1995)
Mean ERM
quotient
(MERM-Q)
MERM-Q
=
P n
i¼1
Ci=ERMi
ð
Þ=n
C i = [metal]; ERM i =
guideline values**;
n = the number of heavy
metal.
MERM-Q: < 0.1, [0.11–0.5],
[0.51–1.5] and >1.50 are
9%, 21%, 49%, and 76%
respectively.
Representing low,
medium-low, mediumhigh, and high-priority
sites respectively.
Long and
MacDonald
(1998)
*Turekian and Wedepohl (1961) were used as background values to calculate Igeo and EF.
**Burton and Allen (2002) guideline values.
JOURNAL OF APPLIED AQUACULTURE
5
and (TOM) (1.2% to 3.1%) respectively.
The values reported in the fish farm area were significantly higher (P < 0.001)
than those of the reference station. The organic matter content is almost 3 times
the reference site content. It indicates that organic waste is mainly loaded on the
sediment just beneath the fish cages. The highest concentrations of trace metals
Cd, Cu, Fe, Pb, Zn, and organic matter were measured under the fish cages
compared to concentrations in the reference zone. This result was supported by
highly significant intersite ERs (P < 0.01). The lowest concentrations were
recorded at S4 (400 m beyond the fish farm). The concentrations of Zn under
the fish cages and near the fish cages were very high compared with the respective
Table 2. Indices used to assess pollution and ecological risk of sediment from fish farm.
Indexes
Equations
Details
Interpretation/Classification
References
The
enrichment
ratio (ER)
ER = (X m - X r ) *100/
X r
X m : [metal] in mariculture
sites;
X r :[metal]at reference
site
ER ≥ 0: the parameters in
mariculture sites were
higher than reference
site;
ER < 0: the parameters in
mariculture sites were
lower than reference site.
Liang et al.
(2011)
The geocumulative
index (Igeo)
Igeo = Log 2[C i /1.5
B i ]
C i = [metal] in sediment;
1.5 = the correction
factor due to lithogenic
effects, B i is the
geochemical background
value of a particular
heavy metal.*
Igeo < 0 = Uncontaminated;
[0– 1] = Unpolluted to
moderately Unpolluted;
[1– 2] = moderately
Unpolluted; [2– 3] =
Moderately to heavily
polluted; [3– 4] = Heavily
polluted;
[4– 5] = Heavily to
extremely polluted;
Igeo > 5 = extremely
polluted.
Müller (1969)
Enrichment
factor (EF)
EF = (C x/C Fe)
sample /
(C x/C Fe)
background
(C x/C Fe) sample = the ratio
of [metal]and [Fe] of
sample; (Cx/CFe)
background = the ratio of
[metal] and [Fe] of
reference baseline *
EF < 2 = deficiency to
minimal enrichment; 2
< EF < 5 = moderate
pollution; 5< EF < 20 =
significant enrichment;
EF > 50 = extremely high
enrichment.
Jahan and
Strezov
(2018);
Nour et al.
(2018)
Adverse
Effects
Index (AEI)
AEI = Met/ERL
Met = [metal]; ERL = effects
range-low (Cd = 1.2,
Cu = 34, Pb = 46.7,
Zn = 150 ug/g).
AEI ≤ 1 = [metal] in the
sample is not high
sufficient to cause
adverse effects in biota;
AEI 1 = [metal] in the
sample may have harmful
effects.
MuñozBarbosa
et al.
(2012);
Long et al.
(1995)
Mean ERM
quotient
(MERM-Q)
MERM-Q
=
P n
i¼1
Ci=ERMi
ð
Þ=n
C i = [metal]; ERM i =
guideline values**;
n = the number of heavy
metal.
MERM-Q: < 0.1, [0.11–0.5],
[0.51–1.5] and >1.50 are
9%, 21%, 49%, and 76%
respectively.
Representing low,
medium-low, mediumhigh, and high-priority
sites respectively.
Long and
MacDonald
(1998)
*Turekian and Wedepohl (1961) were used as background values to calculate Igeo and EF.
**Burton and Allen (2002) guideline values.
JOURNAL OF APPLIED AQUACULTURE
5