

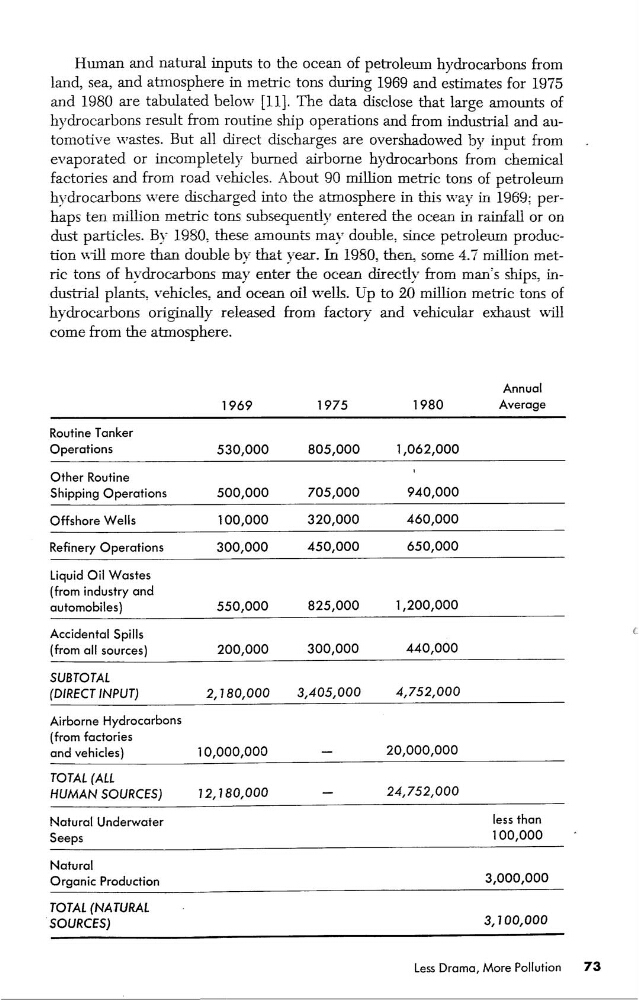
Human and natural inputs to the ocean of petroleum hydrocarbons from
land sea, and atmosphere in metric tons during 1969 and estimates for 1975
and 1980 are tabulated below [11]. The data disclose that large amounts of
hydrocarbons result from routine ship operations and from industrial and au—
tomotive wastes. But all direct discharges are overshadowed by input from
.
evaporated or incompletely bumed airborne hydrocarbons from chemical
factories and from road vehicles. About 90 million metric tons of petroleum
hydrocarbons were discharged into the atmosphere in this way in 1969; perhaps ten million metric tons subsequently entered the ocean in rain£all or on
dust particles. By 1980, these amounts may double, since petroleum produc—
tion Will more than double by that year. In 1980, then, some 4.7 million metric tons of hydrocarbons may enter the ocean directly from man’s
industrial plants, vehicles, and ocean oil wells. Up to 20 million metric tons of
hydrocarbons originally released rom factory and vehicular exhaust Will
come from the atmosphere.
Annual
1969
1975
1980
Average
Routine Tanker
Operations
530,000
805,000
1,062,000
Other Routine
'
Shipping Operations
500,000
705,000
940,000
Offshore Wells
100,000
320,000
460,000
Renery Operations
300,000
450,000
650,000
Liquid Oil Wastes
(from industry and
automobiles)
550,000
825,000
1,200,000
Accidental Spills
.
(from all sources)
200,000
300,000
440,000
SUBTOTAL
(DIRECT INPUT)
2,180,000
3,405,000
4,752,000
Airborne Hydrocarbons
(from factories
and vehicles)
10,000,000
—
20,000,000
TOTAL (ALL
HUMAN SOURCES)
12,180,000
—
24,752,000
Natural Underwater
less than
Seeps
100,000
“
Natural
Organic Production
3,000,000
TOTAL {NATURAL
»
SOURCES)
3,100,000
___—___—
Less Drama, More Pollution
73
land sea, and atmosphere in metric tons during 1969 and estimates for 1975
and 1980 are tabulated below [11]. The data disclose that large amounts of
hydrocarbons result from routine ship operations and from industrial and au—
tomotive wastes. But all direct discharges are overshadowed by input from
.
evaporated or incompletely bumed airborne hydrocarbons from chemical
factories and from road vehicles. About 90 million metric tons of petroleum
hydrocarbons were discharged into the atmosphere in this way in 1969; perhaps ten million metric tons subsequently entered the ocean in rain£all or on
dust particles. By 1980, these amounts may double, since petroleum produc—
tion Will more than double by that year. In 1980, then, some 4.7 million metric tons of hydrocarbons may enter the ocean directly from man’s
industrial plants, vehicles, and ocean oil wells. Up to 20 million metric tons of
hydrocarbons originally released rom factory and vehicular exhaust Will
come from the atmosphere.
Annual
1969
1975
1980
Average
Routine Tanker
Operations
530,000
805,000
1,062,000
Other Routine
'
Shipping Operations
500,000
705,000
940,000
Offshore Wells
100,000
320,000
460,000
Renery Operations
300,000
450,000
650,000
Liquid Oil Wastes
(from industry and
automobiles)
550,000
825,000
1,200,000
Accidental Spills
.
(from all sources)
200,000
300,000
440,000
SUBTOTAL
(DIRECT INPUT)
2,180,000
3,405,000
4,752,000
Airborne Hydrocarbons
(from factories
and vehicles)
10,000,000
—
20,000,000
TOTAL (ALL
HUMAN SOURCES)
12,180,000
—
24,752,000
Natural Underwater
less than
Seeps
100,000
“
Natural
Organic Production
3,000,000
TOTAL {NATURAL
»
SOURCES)
3,100,000
___—___—
Less Drama, More Pollution
73