

70
.
..
.
°°
‘
_
'if:f“
?
—5
50 |
;
..
x_0
|
::o
&
.
‘
|
‘o «
—»…
'
°—
;.
.
€
‘n
'
… …
"
‘
…
°°. '
‘….
.….
….…‘Q.
Inferred carbo f'l
° ° ° ‘Oçb . . .
"
"ercosfs;
…
. '.». . 'n‘
"30 …‘
…...
.
.
;
;
—
«.…
,
,,__
'
—
*.
.
‘
““
T_
-
.
.
‘
:’
…
y
,;
.
‘
.
’
"“
.
Pnmd’r "
Tr“
…‘…
‘
J— :ÏÊe-nî.
.
.
,
.
_
10203040 _..iso
60
70…
00
90100
PopulaämnSemd (in thousands)
—'
»
…
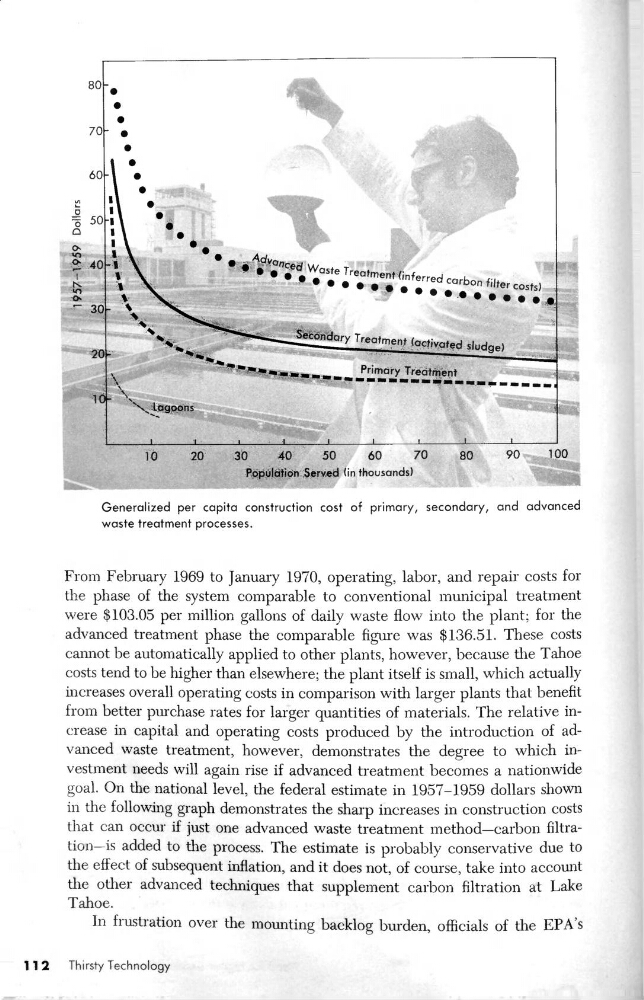
Generalîzed per capita construction cost of primary, secondary, and advanced
waste treatment processes.
From February 1969 to ]anuary 1970, operating, labor, and repair costs for
the phase of the system comparable to conventional municipal treatment
were $103.05 per million gallons of daily waste ow into the plant; for the
advanced treatment phase the comparable gure was $136.51. These costs
cannot be automatically applied to other plants, however, because the Tahoe
costs tend to be higher than elsewhere; the plant itself is small, which actually
increases overall operating costs in comparison with larger plants that benet
from better purchase rates for larger quantities of materials. The relative in—
crease in capital and operating costs produced by the introduction of ad—
vanced waste treatment, however, demonstrates the degree to which in—
vestment needs will again rise if advanced treatment becomes a nationwide
goal. On the national level, the federal estimate in 1957—1959 dollars shown
in the following graph demonstrates the sharp increases in construction costs
that can occur if just one advanced waste treatment method—carbon ltration—is added to the process. The estimate is probably conservative due to
the effect of subsequent ination, and it does not, of course, take into account
the other advanced techniques that supplement carbon ltration at Lake
Tahoe.
In frustration over the mounting backlog burden, ofcials of the EPA’s
1 12
Thirsty Technology
.
..
.
°°
‘
_
'if:f“
?
—5
50 |
;
..
x_0
|
::o
&
.
‘
|
‘o «
—»…
'
°—
;.
.
€
‘n
'
… …
"
‘
…
°°. '
‘….
.….
….…‘Q.
Inferred carbo f'l
° ° ° ‘Oçb . . .
"
"ercosfs;
…
. '.». . 'n‘
"30 …‘
…...
.
.
;
;
—
«.…
,
,,__
'
—
*.
.
‘
““
T_
-
.
.
‘
:’
…
y
,;
.
‘
.
’
"“
.
Pnmd’r "
Tr“
…‘…
‘
J— :ÏÊe-nî.
.
.
,
.
_
10203040 _..iso
60
70…
00
90100
PopulaämnSemd (in thousands)
—'
»
…
Generalîzed per capita construction cost of primary, secondary, and advanced
waste treatment processes.
From February 1969 to ]anuary 1970, operating, labor, and repair costs for
the phase of the system comparable to conventional municipal treatment
were $103.05 per million gallons of daily waste ow into the plant; for the
advanced treatment phase the comparable gure was $136.51. These costs
cannot be automatically applied to other plants, however, because the Tahoe
costs tend to be higher than elsewhere; the plant itself is small, which actually
increases overall operating costs in comparison with larger plants that benet
from better purchase rates for larger quantities of materials. The relative in—
crease in capital and operating costs produced by the introduction of ad—
vanced waste treatment, however, demonstrates the degree to which in—
vestment needs will again rise if advanced treatment becomes a nationwide
goal. On the national level, the federal estimate in 1957—1959 dollars shown
in the following graph demonstrates the sharp increases in construction costs
that can occur if just one advanced waste treatment method—carbon ltration—is added to the process. The estimate is probably conservative due to
the effect of subsequent ination, and it does not, of course, take into account
the other advanced techniques that supplement carbon ltration at Lake
Tahoe.
In frustration over the mounting backlog burden, ofcials of the EPA’s
1 12
Thirsty Technology