

Agriculture and Huno.
The water pollution impact of another agricul—
tural activity—cattle and poultry raising—also is unclear. The potential is
serious, since farm animals produce ten times as much waste as the human
population in the United States [30]. Modern feeding methods that emphasize
highly concentrated feed and small confinement areas for some phases of the
animal’s feeding cycle intensify the problem; in range feeding, wastes are
more readily dispersed and converted into soil nutrients by natural processes.
Organic animal wastes carry human disease organisms such as salmonella and
also deplete dissolved oxygen
in streams. Under current practice, runoff from
animal wastes generally is allowed to flow directly into waterways, or is cir—
culated through anaerobic basins where some biological degradation takes
place, or is spread in pastures or elsewhere on land. Well dispersed land application is the most effective waste disposal measure, reducing pollution en—
tering streams by runoff by as much as 99 percent. Anaerobic basins are gen—
erally unsatisfactory since they produce an efliuent that exceeds raw domestic
sewage in BOD strength. The direct discharge of animal wastes into streams,
practiced in some areas with dairy and swine herds, causes severe pollution.
'
The discharge may result from the intentional channeling of wastes from
feeding areas into the streams or from roving animals given access to the
watercourses. The amount of contamination eventually reaching a waterway
thus depends upon a number of farm management factors, as well as on soil
type and land contours, so that generalizations are difficult without a more
comprehensive picture of farming practices. A field study in North Carolina,
however, is useful in assessing the relative amounts of various pollutants that
can be expected from different animals according to different waste manage—
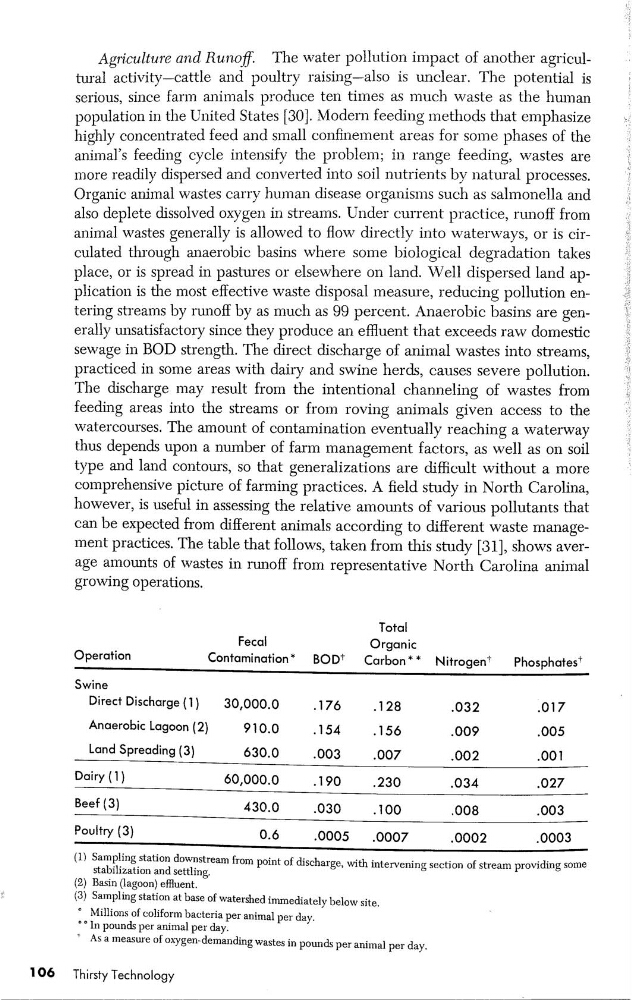
ment practices. The table that follows, taken from this study [81], shows aver—
age amounts of wastes in runoff from representative North Carolina animal
growing operations.
Total
Fecal
Organic
Operation
Contamination*
Carbon* *
Nitrogeni
Phosphotes*
Direct Discharge ('l)
30,000.0
.176
.l 28
.032
-017
Anaerobic Lagoon (2)
910.0
.154
.156
.009
.005
….230
.034
.027
Pou‘fry (3)
0.6
.0005
.0007
.0002
.0003
(1)
downstream from point of discharge, with intervening section of stream providing some
stab1hzatron and setthng.
(2) Basin (lagoon) efuent.
(8) Sampling station at base of watershed immediately below site.
°
Millions of coliform bacteria per animal per day.
° °
In pounds per animal per day.
*
As a measure of oxygen—demanding wastes in pounds per animal per day.
106
Thirsty Technology
The water pollution impact of another agricul—
tural activity—cattle and poultry raising—also is unclear. The potential is
serious, since farm animals produce ten times as much waste as the human
population in the United States [30]. Modern feeding methods that emphasize
highly concentrated feed and small confinement areas for some phases of the
animal’s feeding cycle intensify the problem; in range feeding, wastes are
more readily dispersed and converted into soil nutrients by natural processes.
Organic animal wastes carry human disease organisms such as salmonella and
also deplete dissolved oxygen
in streams. Under current practice, runoff from
animal wastes generally is allowed to flow directly into waterways, or is cir—
culated through anaerobic basins where some biological degradation takes
place, or is spread in pastures or elsewhere on land. Well dispersed land application is the most effective waste disposal measure, reducing pollution en—
tering streams by runoff by as much as 99 percent. Anaerobic basins are gen—
erally unsatisfactory since they produce an efliuent that exceeds raw domestic
sewage in BOD strength. The direct discharge of animal wastes into streams,
practiced in some areas with dairy and swine herds, causes severe pollution.
'
The discharge may result from the intentional channeling of wastes from
feeding areas into the streams or from roving animals given access to the
watercourses. The amount of contamination eventually reaching a waterway
thus depends upon a number of farm management factors, as well as on soil
type and land contours, so that generalizations are difficult without a more
comprehensive picture of farming practices. A field study in North Carolina,
however, is useful in assessing the relative amounts of various pollutants that
can be expected from different animals according to different waste manage—
ment practices. The table that follows, taken from this study [81], shows aver—
age amounts of wastes in runoff from representative North Carolina animal
growing operations.
Total
Fecal
Organic
Operation
Contamination*
Carbon* *
Nitrogeni
Phosphotes*
Direct Discharge ('l)
30,000.0
.176
.l 28
.032
-017
Anaerobic Lagoon (2)
910.0
.154
.156
.009
.005
….230
.034
.027
Pou‘fry (3)
0.6
.0005
.0007
.0002
.0003
(1)
downstream from point of discharge, with intervening section of stream providing some
stab1hzatron and setthng.
(2) Basin (lagoon) efuent.
(8) Sampling station at base of watershed immediately below site.
°
Millions of coliform bacteria per animal per day.
° °
In pounds per animal per day.
*
As a measure of oxygen—demanding wastes in pounds per animal per day.
106
Thirsty Technology