

363
What Is Aura and What Does It Do?
spectrum as well as the ultraviolet portion of the electromagnetic spectrum.
Back in Chapter 10, we discussed how the atmosphere absorbs a lot of electromagnetic radiation and that ozone is the primary greenhouse gas that absorbs
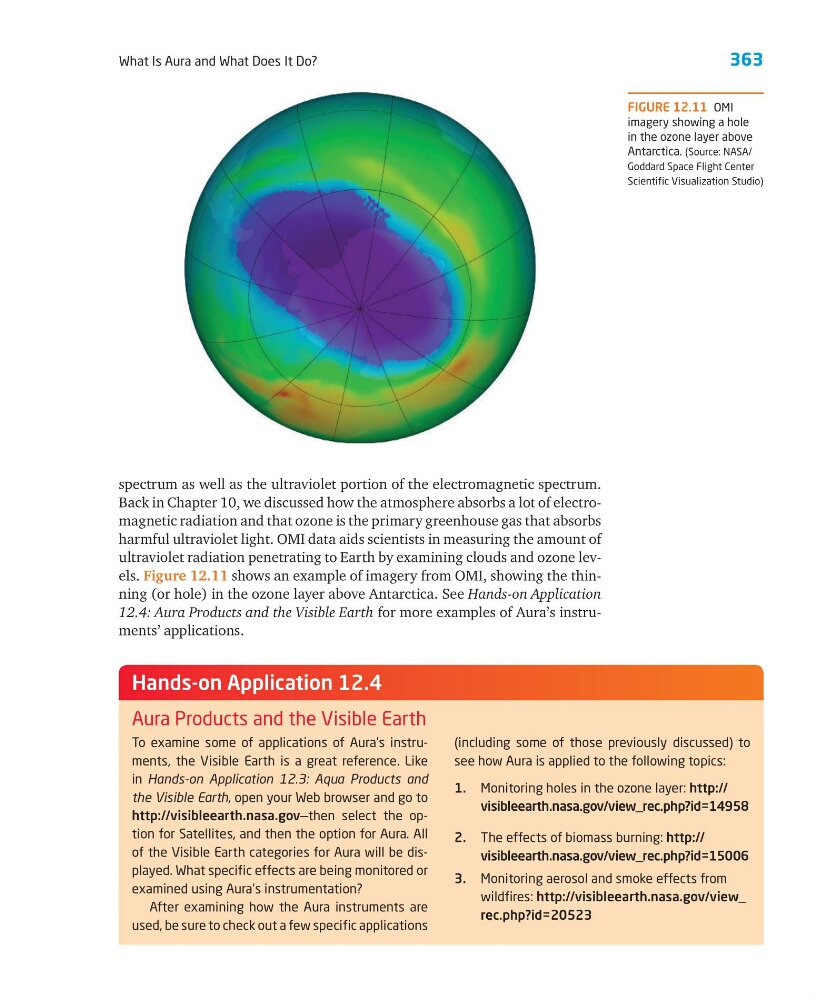
harmful ultraviolet light. OMI data aids scientists in measuring the amount of
ultraviolet radiation penetrating to Earth by examining clouds and ozone levels. Figure 12.11 shows an example of imagery from OMI, showing the thinning (or hole) in the ozone layer above Antarctica. See Hands-on Application
12.4: Aura Products and the Visible Earth for more examples of Aura’s instruments’ applications.
FIGURE 12.11 OMI
imagery showing a hole
in the ozone layer above
Antarctica. (Source: NASA/
Goddard Space Flight Center
Scientific Visualization Studio)
To examine some of applications of Aura’s instruments, the Visible Earth is a great reference. Like
in Hands-on Application 12.3: Aqua Products and
the Visible Earth, open your Web browser and go to
http://visibleearth.nasa.gov—then select the option for Satellites, and then the option for Aura. All
of the Visible Earth categories for Aura will be displayed. What specific effects are being monitored or
examined using Aura’s instrumentation?
After examining how the Aura instruments are
used, be sure to check out a few specific applications
(including some of those previously discussed) to
see how Aura is applied to the following topics:
1. Monitoring holes in the ozone layer: http://
visibleearth.nasa.gov/view_rec.php?id=14958
2. The effects of biomass burning: http://
visibleearth.nasa.gov/view_rec.php?id=15006
3. Monitoring aerosol and smoke effects from
wildfires: http://visibleearth.nasa.gov/view_
rec.php?id=20523
Hands-on Application 12.4
Aura Products and the Visible Earth
What Is Aura and What Does It Do?
spectrum as well as the ultraviolet portion of the electromagnetic spectrum.
Back in Chapter 10, we discussed how the atmosphere absorbs a lot of electromagnetic radiation and that ozone is the primary greenhouse gas that absorbs
harmful ultraviolet light. OMI data aids scientists in measuring the amount of
ultraviolet radiation penetrating to Earth by examining clouds and ozone levels. Figure 12.11 shows an example of imagery from OMI, showing the thinning (or hole) in the ozone layer above Antarctica. See Hands-on Application
12.4: Aura Products and the Visible Earth for more examples of Aura’s instruments’ applications.
FIGURE 12.11 OMI
imagery showing a hole
in the ozone layer above
Antarctica. (Source: NASA/
Goddard Space Flight Center
Scientific Visualization Studio)
To examine some of applications of Aura’s instruments, the Visible Earth is a great reference. Like
in Hands-on Application 12.3: Aqua Products and
the Visible Earth, open your Web browser and go to
http://visibleearth.nasa.gov—then select the option for Satellites, and then the option for Aura. All
of the Visible Earth categories for Aura will be displayed. What specific effects are being monitored or
examined using Aura’s instrumentation?
After examining how the Aura instruments are
used, be sure to check out a few specific applications
(including some of those previously discussed) to
see how Aura is applied to the following topics:
1. Monitoring holes in the ozone layer: http://
visibleearth.nasa.gov/view_rec.php?id=14958
2. The effects of biomass burning: http://
visibleearth.nasa.gov/view_rec.php?id=15006
3. Monitoring aerosol and smoke effects from
wildfires: http://visibleearth.nasa.gov/view_
rec.php?id=20523
Hands-on Application 12.4
Aura Products and the Visible Earth