

347
Landsat Imagery
8. Open the ‘clevsub’ image with a 4-3-2 combination (band 4 in the red
gun, band 3 in the green gun, and band 2 in the blue gun).
9. Use the other defaults for the Enhancement options (stretch is Linear
and range is Clip 2% of tails).
10. In the Set Histogram Specifications dialog box that opens, select
the Compute new histogram method, and use the default Area to
Histogram settings.
11. Click OK when ready. The new subset image shows that the Cleveland
area is ready to use.
12. Zoom into the downtown Cleveland area and especially areas along
the waterfront. Answer Questions 11.1 and 11.2. (You will want to also
open Google Earth and compare the Landsat image to its very crisp
resolution imagery when answering these questions.)
Question 11.1 What kinds of features on the Cleveland waterfront cannot
be distinguished at the 30-meter resolution you’re examining?
Question 11.2 Conversely, what specific features on the Cleveland
waterfront are apparent at the 30-meter resolution you’re examining?
11.3 Examining Landsat Bands
and Band Combinations
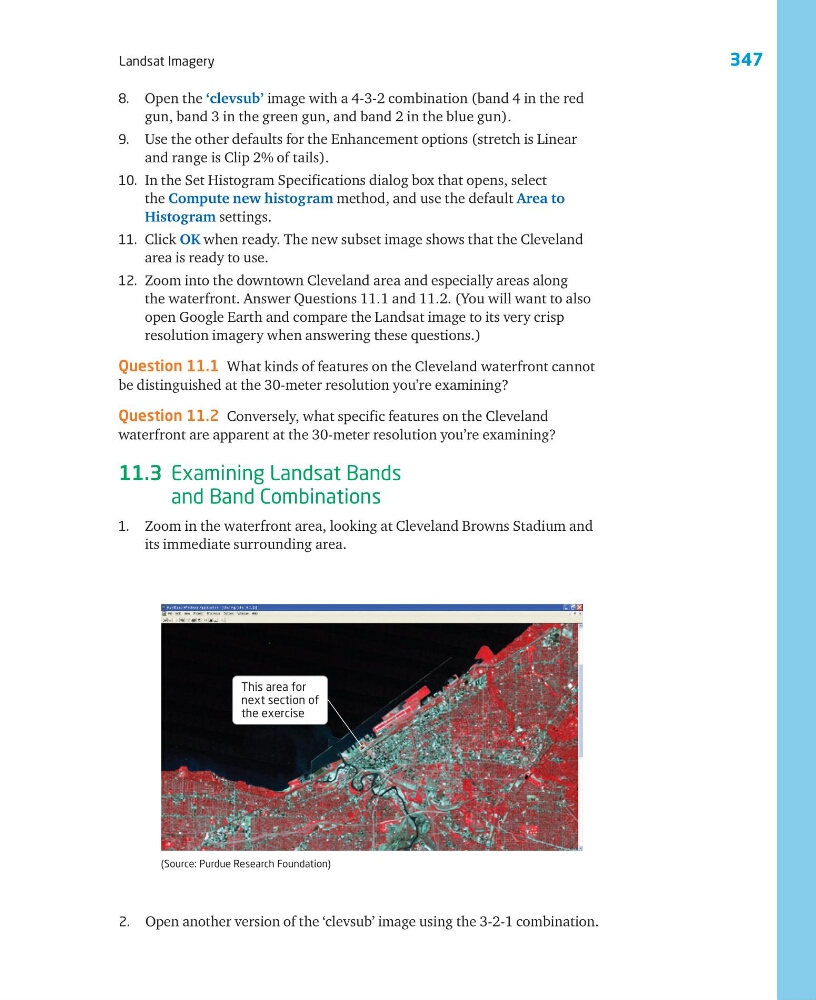
1. Zoom in the waterfront area, looking at Cleveland Browns Stadium and
its immediate surrounding area.
This area for
next section of
the exercise
(Source: Purdue Research Foundation)
2. Open another version of the ‘clevsub’ image using the 3-2-1 combination.
Landsat Imagery
8. Open the ‘clevsub’ image with a 4-3-2 combination (band 4 in the red
gun, band 3 in the green gun, and band 2 in the blue gun).
9. Use the other defaults for the Enhancement options (stretch is Linear
and range is Clip 2% of tails).
10. In the Set Histogram Specifications dialog box that opens, select
the Compute new histogram method, and use the default Area to
Histogram settings.
11. Click OK when ready. The new subset image shows that the Cleveland
area is ready to use.
12. Zoom into the downtown Cleveland area and especially areas along
the waterfront. Answer Questions 11.1 and 11.2. (You will want to also
open Google Earth and compare the Landsat image to its very crisp
resolution imagery when answering these questions.)
Question 11.1 What kinds of features on the Cleveland waterfront cannot
be distinguished at the 30-meter resolution you’re examining?
Question 11.2 Conversely, what specific features on the Cleveland
waterfront are apparent at the 30-meter resolution you’re examining?
11.3 Examining Landsat Bands
and Band Combinations
1. Zoom in the waterfront area, looking at Cleveland Browns Stadium and
its immediate surrounding area.
This area for
next section of
the exercise
(Source: Purdue Research Foundation)
2. Open another version of the ‘clevsub’ image using the 3-2-1 combination.