

320
Chapter 10 How Remote Sensing Works
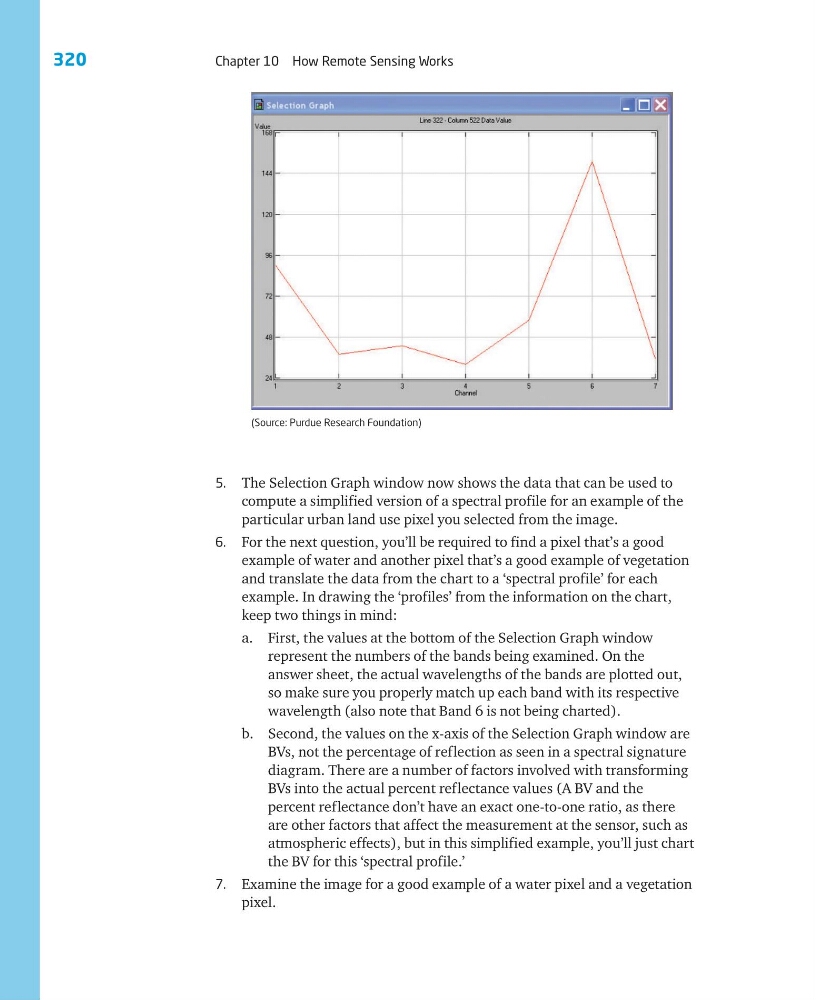
5. The Selection Graph window now shows the data that can be used to
compute a simplified version of a spectral profile for an example of the
particular urban land use pixel you selected from the image.
6. For the next question, you’ll be required to find a pixel that’s a good
example of water and another pixel that’s a good example of vegetation
and translate the data from the chart to a ‘spectral profile’ for each
example. In drawing the ‘profiles’ from the information on the chart,
keep two things in mind:
a. First, the values at the bottom of the Selection Graph window
represent the numbers of the bands being examined. On the
answer sheet, the actual wavelengths of the bands are plotted out,
so make sure you properly match up each band with its respective
wavelength (also note that Band 6 is not being charted).
b. Second, the values on the x-axis of the Selection Graph window are
BVs, not the percentage of reflection as seen in a spectral signature
diagram. There are a number of factors involved with transforming
BVs into the actual percent reflectance values (A BV and the
percent reflectance don’t have an exact one-to-one ratio, as there
are other factors that affect the measurement at the sensor, such as
atmospheric effects), but in this simplified example, you’ll just chart
the BV for this ‘spectral profile.’
7. Examine the image for a good example of a water pixel and a vegetation
pixel.
(Source: Purdue Research Foundation)
Chapter 10 How Remote Sensing Works
5. The Selection Graph window now shows the data that can be used to
compute a simplified version of a spectral profile for an example of the
particular urban land use pixel you selected from the image.
6. For the next question, you’ll be required to find a pixel that’s a good
example of water and another pixel that’s a good example of vegetation
and translate the data from the chart to a ‘spectral profile’ for each
example. In drawing the ‘profiles’ from the information on the chart,
keep two things in mind:
a. First, the values at the bottom of the Selection Graph window
represent the numbers of the bands being examined. On the
answer sheet, the actual wavelengths of the bands are plotted out,
so make sure you properly match up each band with its respective
wavelength (also note that Band 6 is not being charted).
b. Second, the values on the x-axis of the Selection Graph window are
BVs, not the percentage of reflection as seen in a spectral signature
diagram. There are a number of factors involved with transforming
BVs into the actual percent reflectance values (A BV and the
percent reflectance don’t have an exact one-to-one ratio, as there
are other factors that affect the measurement at the sensor, such as
atmospheric effects), but in this simplified example, you’ll just chart
the BV for this ‘spectral profile.’
7. Examine the image for a good example of a water pixel and a vegetation
pixel.
(Source: Purdue Research Foundation)