

305
How Can Spectral Reflectance Be Used in Remote Sensing?
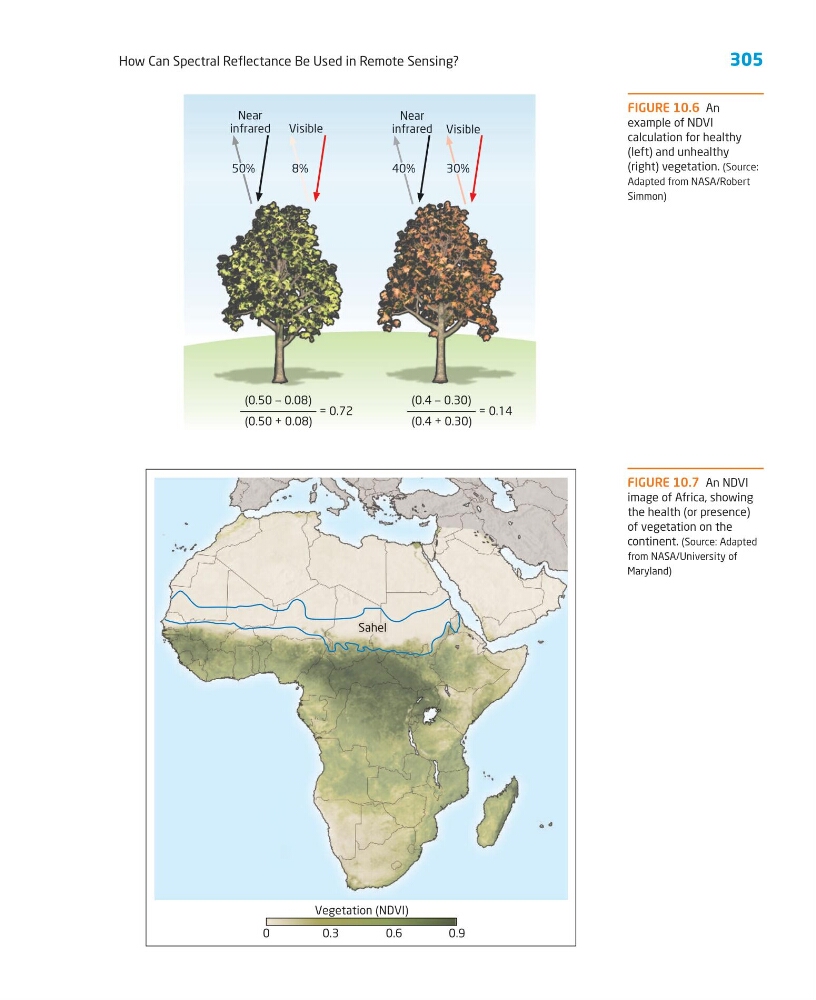
FIGURE 10.6 An
example of NDVI
calculation for healthy
(left) and unhealthy
(right) vegetation. (Source:
Adapted from NASA/Robert
Simmon)
Near
infrared
Visible
Near
infrared Visible
50%
50%
40% 40%
50% 50%
40% 40%
8% 8%
30% 30%
50%
40%
8%
30%
(0.50 — 0.08)
= 0.72
(0.50 + 0.08)
(0.4 — 0.30)
= 0.14
(0.4 + 0.30)
FIGURE 10.7 An NDVI
image of Africa, showing
the health (or presence)
of vegetation on the
continent. (Source: Adapted
from NASA/University of
Maryland)
Sahel Sahel Sahel
0
0.3
Vegetation (NDVI)
0.6
0.9
How Can Spectral Reflectance Be Used in Remote Sensing?
FIGURE 10.6 An
example of NDVI
calculation for healthy
(left) and unhealthy
(right) vegetation. (Source:
Adapted from NASA/Robert
Simmon)
Near
infrared
Visible
Near
infrared Visible
50%
50%
40% 40%
50% 50%
40% 40%
8% 8%
30% 30%
50%
40%
8%
30%
(0.50 — 0.08)
= 0.72
(0.50 + 0.08)
(0.4 — 0.30)
= 0.14
(0.4 + 0.30)
FIGURE 10.7 An NDVI
image of Africa, showing
the health (or presence)
of vegetation on the
continent. (Source: Adapted
from NASA/University of
Maryland)
Sahel Sahel Sahel
0
0.3
Vegetation (NDVI)
0.6
0.9