

304
Chapter 10 How Remote Sensing Works
absorption of red energy. As the vegetation becomes more stressed, less nearinfrared energy will be reflected and more red energy will be reflected rather
than being absorbed. An image can be processed to have a way of measuring the healthiness of vegetated areas. The Normalized Difference Vegetation
Index (NDVI) is a means of doing so—the process takes a remotely sensed
image and creates a new NDVI image from it, containing values related to the
relative health of the vegetation being examined. As long as the sensor can
measure the red and near-infrared portions of the electromagnetic spectrum,
NDVI can be calculated.
NDVI is computed using the measurements for the red and near-infrared
bands. The formula for NDVI is:
(NIR Ϫ Red)
(NIR ϩ Red)
NDVI returns a value between Ϫ1 and ϩ1, with the higher the value
( closer to 1), the healthier the vegetation is at the area being measured. Low
values indicate unhealthy vegetation or a lack of biomass. Very low or negative values indicate non-vegetated areas (things like pavement, clouds, or ice).
Figure 10.6 shows an example of NDVI being calculated for both a healthy
vegetation source (one that reflects a high amount of near-infrared energy
and less red energy), resulting in a high NDVI value (0.72) and an unhealthy
source (which reflects less near-infrared energy and more red energy), which
results in a lower NDVI value (0.14).
NDVI can be calculated by a variety of remote sensing devices, so long
as their sensors can measure the red and near-infrared bands (which several of the specific sensors discussed in the next two chapters can do).
NDVI gives a quick means of assessing vegetation health, which is used
for a variety of environmental applications, including crop monitoring or
global vegetative conditions (see Figure 10.7 for an example and Hands-on
Application 10.2: Examining NDVI with NASA ICE on page 306 to use some
remotely sensed imagery to examine the health of a rainforest).
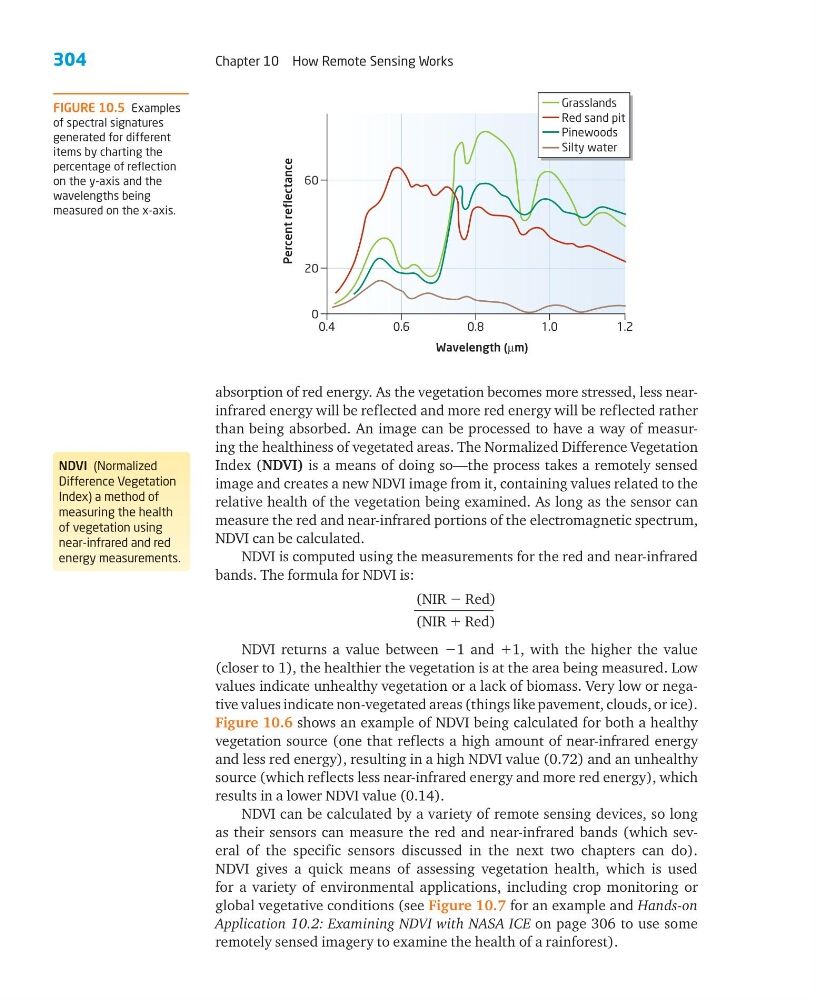
FIGURE 10.5 Examples
of spectral signatures
generated for different
items by charting the
percentage of reflection
on the y-axis and the
wavelengths being
measured on the x-axis.
NDVI (Normalized
Difference Vegetation
Index) a method of
measuring the health
of vegetation using
near-infrared and red
energy measurements.
0.4
0.6
0.8
1.0
1.2
0
20
60
Percent reflectance
Wavelength (µm)
Pinewoods
Grasslands
Red sand pit
Silty water
Chapter 10 How Remote Sensing Works
absorption of red energy. As the vegetation becomes more stressed, less nearinfrared energy will be reflected and more red energy will be reflected rather
than being absorbed. An image can be processed to have a way of measuring the healthiness of vegetated areas. The Normalized Difference Vegetation
Index (NDVI) is a means of doing so—the process takes a remotely sensed
image and creates a new NDVI image from it, containing values related to the
relative health of the vegetation being examined. As long as the sensor can
measure the red and near-infrared portions of the electromagnetic spectrum,
NDVI can be calculated.
NDVI is computed using the measurements for the red and near-infrared
bands. The formula for NDVI is:
(NIR Ϫ Red)
(NIR ϩ Red)
NDVI returns a value between Ϫ1 and ϩ1, with the higher the value
( closer to 1), the healthier the vegetation is at the area being measured. Low
values indicate unhealthy vegetation or a lack of biomass. Very low or negative values indicate non-vegetated areas (things like pavement, clouds, or ice).
Figure 10.6 shows an example of NDVI being calculated for both a healthy
vegetation source (one that reflects a high amount of near-infrared energy
and less red energy), resulting in a high NDVI value (0.72) and an unhealthy
source (which reflects less near-infrared energy and more red energy), which
results in a lower NDVI value (0.14).
NDVI can be calculated by a variety of remote sensing devices, so long
as their sensors can measure the red and near-infrared bands (which several of the specific sensors discussed in the next two chapters can do).
NDVI gives a quick means of assessing vegetation health, which is used
for a variety of environmental applications, including crop monitoring or
global vegetative conditions (see Figure 10.7 for an example and Hands-on
Application 10.2: Examining NDVI with NASA ICE on page 306 to use some
remotely sensed imagery to examine the health of a rainforest).
FIGURE 10.5 Examples
of spectral signatures
generated for different
items by charting the
percentage of reflection
on the y-axis and the
wavelengths being
measured on the x-axis.
NDVI (Normalized
Difference Vegetation
Index) a method of
measuring the health
of vegetation using
near-infrared and red
energy measurements.
0.4
0.6
0.8
1.0
1.2
0
20
60
Percent reflectance
Wavelength (µm)
Pinewoods
Grasslands
Red sand pit
Silty water