

215
GIS Layouts: ArcGIS Version
7.4 Layouts in ArcMap
1. To begin laying out the print-quality version of the map, you’ll need
to begin working in the Layout View. This mode of ArcMap works
like a blank canvas, allowing you to construct a map using various
elements.
2. Note that whatever appears in the Data View will also appear in the
Layout View. For instance, if you zoom the Map View to only show
Ohio, and then switch to Layout View, the layout will only show
Ohio.
3. To begin, select Layout View from the View pull-down menu.
a. You can switch back to the Data View by selecting Data View from the
View pull-down menu.
b. You can also switch between Layout and Data Views by using the
icons at the bottom left-hand corner of the View.
Layout view
Data view
4. In the Layout View, the black border around the white page represents
the border of the printed page of an 8½ ϫ 11 piece of paper, so be
careful when working near the edges of the page and keep all elements
of the map within that border.
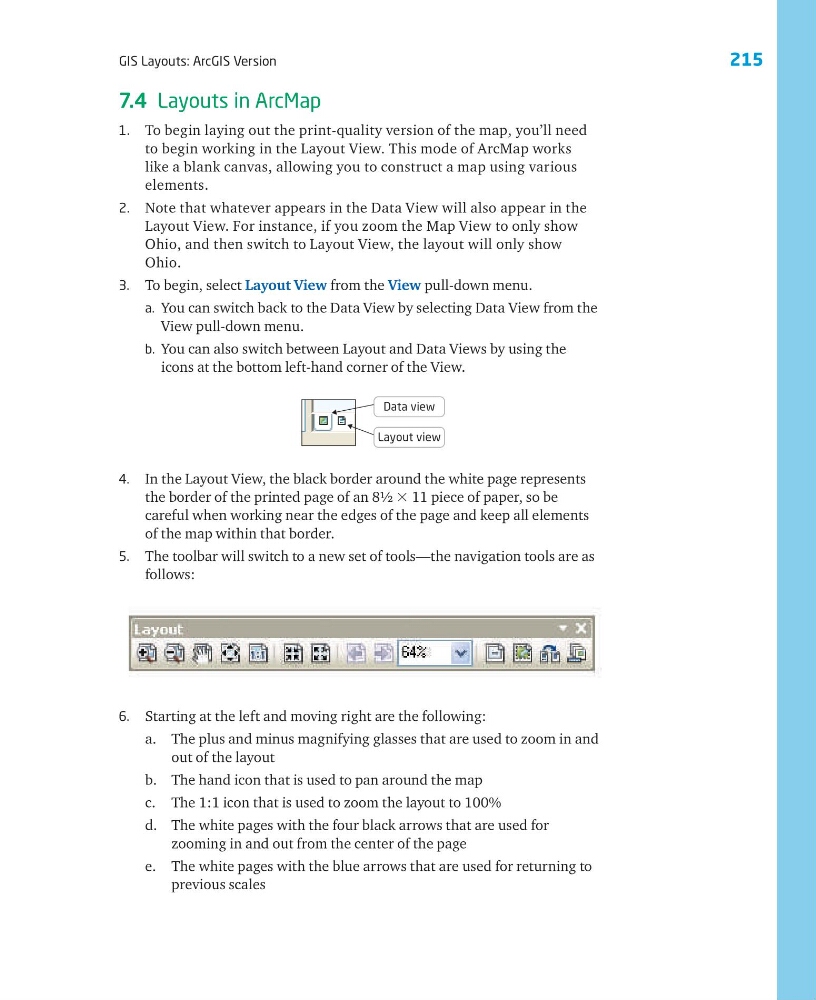
5. The toolbar will switch to a new set of tools—the navigation tools are as
follows:
6. Starting at the left and moving right are the following:
a. The plus and minus magnifying glasses that are used to zoom in and
out of the layout
b. The hand icon that is used to pan around the map
c. The 1:1 icon that is used to zoom the layout to 100%
d. The white pages with the four black arrows that are used for
zooming in and out from the center of the page
e. The white pages with the blue arrows that are used for returning to
previous scales
GIS Layouts: ArcGIS Version
7.4 Layouts in ArcMap
1. To begin laying out the print-quality version of the map, you’ll need
to begin working in the Layout View. This mode of ArcMap works
like a blank canvas, allowing you to construct a map using various
elements.
2. Note that whatever appears in the Data View will also appear in the
Layout View. For instance, if you zoom the Map View to only show
Ohio, and then switch to Layout View, the layout will only show
Ohio.
3. To begin, select Layout View from the View pull-down menu.
a. You can switch back to the Data View by selecting Data View from the
View pull-down menu.
b. You can also switch between Layout and Data Views by using the
icons at the bottom left-hand corner of the View.
Layout view
Data view
4. In the Layout View, the black border around the white page represents
the border of the printed page of an 8½ ϫ 11 piece of paper, so be
careful when working near the edges of the page and keep all elements
of the map within that border.
5. The toolbar will switch to a new set of tools—the navigation tools are as
follows:
6. Starting at the left and moving right are the following:
a. The plus and minus magnifying glasses that are used to zoom in and
out of the layout
b. The hand icon that is used to pan around the map
c. The 1:1 icon that is used to zoom the layout to 100%
d. The white pages with the four black arrows that are used for
zooming in and out from the center of the page
e. The white pages with the blue arrows that are used for returning to
previous scales