

202
Chapter 7 Using GIS to Make a Map
3. Under “Draw features using:” select Graduated Symbols.
4. The Field to use (in this exercise) is the POP05_SQMI (the states’
population per square mile from the year 2005).
5. Use 5 for the number of Classes.
6. Use Quantile for the Classified by option.
7. For the color scheme, select an appropriate choice for the Start and End
choices. (The default should be yellow for Start and red for End, thus
giving you a range from yellow to orange to red for the five classes.)
8. When you have things arranged how you want them, click Apply to
make the changes. Take a look at the map and make any color changes
you think are needed.
9. Click OK to close the dialog box.
10. Now, the symbology of the states has changed in the View and the values
that make up each one of the breaks can be seen in the TOC.
7.3 Layouts in AEJEE
To begin laying out the print-quality version of the map, you’ll need to begin
working in the Layout View. This mode of AEJEE works like a blank canvas,
allowing you to construct a map using various elements. Note that whatever
appears in the Map View will also appear in the Layout View. For instance, if
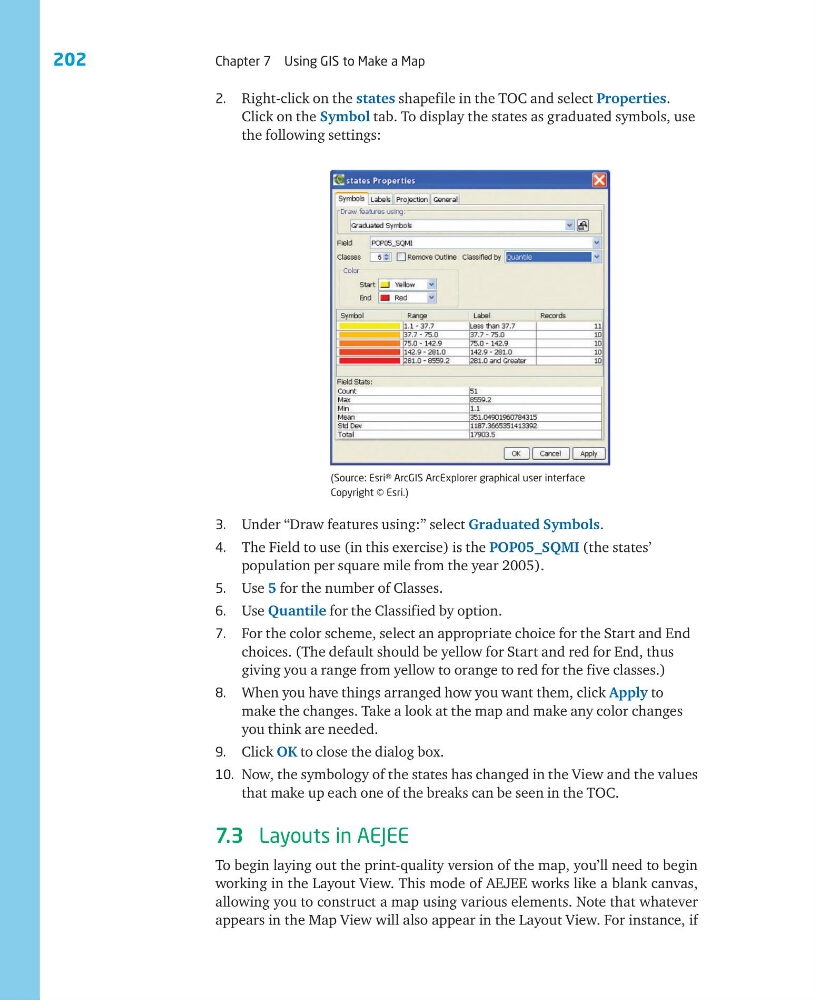
(Source: Esri® ArcGIS ArcExplorer graphical user interface
Copyright © Esri.)
2. Right-click on the states shapefile in the TOC and select Properties.
Click on the Symbol tab. To display the states as graduated symbols, use
the following settings:
Chapter 7 Using GIS to Make a Map
3. Under “Draw features using:” select Graduated Symbols.
4. The Field to use (in this exercise) is the POP05_SQMI (the states’
population per square mile from the year 2005).
5. Use 5 for the number of Classes.
6. Use Quantile for the Classified by option.
7. For the color scheme, select an appropriate choice for the Start and End
choices. (The default should be yellow for Start and red for End, thus
giving you a range from yellow to orange to red for the five classes.)
8. When you have things arranged how you want them, click Apply to
make the changes. Take a look at the map and make any color changes
you think are needed.
9. Click OK to close the dialog box.
10. Now, the symbology of the states has changed in the View and the values
that make up each one of the breaks can be seen in the TOC.
7.3 Layouts in AEJEE
To begin laying out the print-quality version of the map, you’ll need to begin
working in the Layout View. This mode of AEJEE works like a blank canvas,
allowing you to construct a map using various elements. Note that whatever
appears in the Map View will also appear in the Layout View. For instance, if
(Source: Esri® ArcGIS ArcExplorer graphical user interface
Copyright © Esri.)
2. Right-click on the states shapefile in the TOC and select Properties.
Click on the Symbol tab. To display the states as graduated symbols, use
the following settings: