

188
Chapter 7 Using GIS to Make a Map
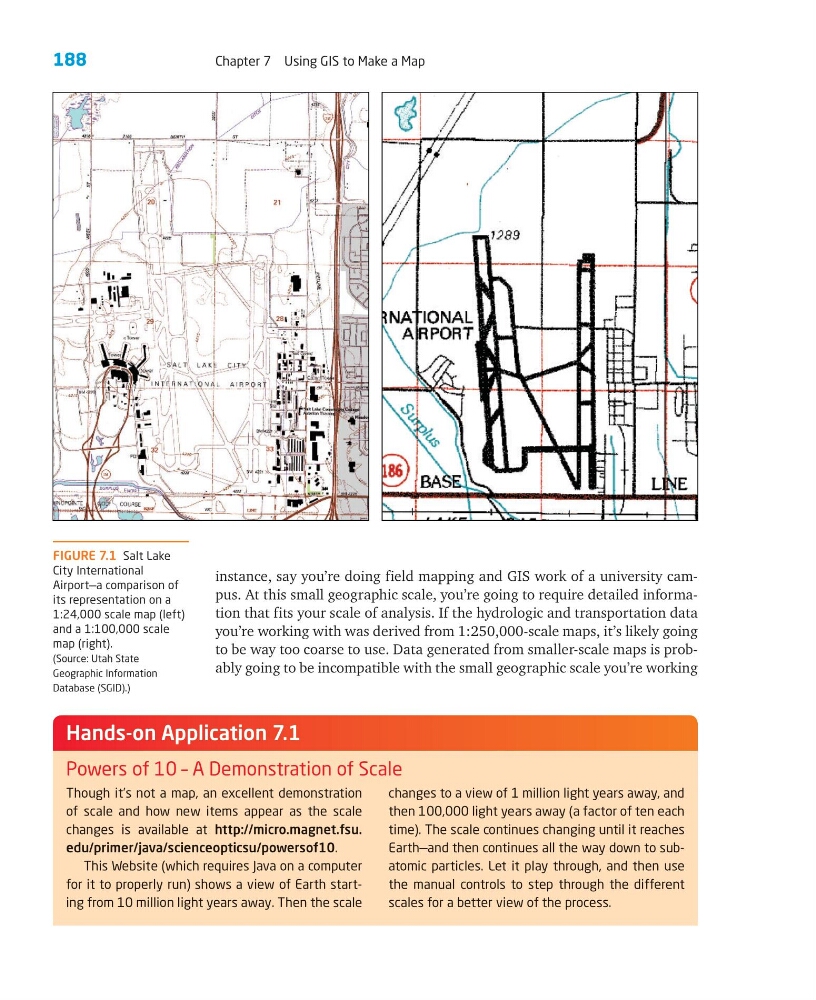
FIGURE 7.1 Salt Lake
City International
Airport—a comparison of
its representation on a
1:24,000 scale map (left)
and a 1:100,000 scale
map (right).
(Source: Utah State
Geographic Information
Database (SGID).)
instance, say you’re doing field mapping and GIS work of a university campus. At this small geographic scale, you’re going to require detailed information that fits your scale of analysis. If the hydrologic and transportation data
you’re working with was derived from 1:250,000-scale maps, it’s likely going
to be way too coarse to use. Data generated from smaller-scale maps is probably going to be incompatible with the small geographic scale you’re working
Though it’s not a map, an excellent demonstration
of scale and how new items appear as the scale
changes is available at http://micro.magnet.fsu.
edu/primer/java/scienceopticsu/powersof10.
This Website (which requires Java on a computer
for it to properly run) shows a view of Earth starting from 10 million light years away. Then the scale
changes to a view of 1 million light years away, and
then 100,000 light years away (a factor of ten each
time). The scale continues changing until it reaches
Earth—and then continues all the way down to subatomic particles. Let it play through, and then use
the manual controls to step through the different
scales for a better view of the process.
Hands-on Application 7.1
Powers of 10 – A Demonstration of Scale
Chapter 7 Using GIS to Make a Map
FIGURE 7.1 Salt Lake
City International
Airport—a comparison of
its representation on a
1:24,000 scale map (left)
and a 1:100,000 scale
map (right).
(Source: Utah State
Geographic Information
Database (SGID).)
instance, say you’re doing field mapping and GIS work of a university campus. At this small geographic scale, you’re going to require detailed information that fits your scale of analysis. If the hydrologic and transportation data
you’re working with was derived from 1:250,000-scale maps, it’s likely going
to be way too coarse to use. Data generated from smaller-scale maps is probably going to be incompatible with the small geographic scale you’re working
Though it’s not a map, an excellent demonstration
of scale and how new items appear as the scale
changes is available at http://micro.magnet.fsu.
edu/primer/java/scienceopticsu/powersof10.
This Website (which requires Java on a computer
for it to properly run) shows a view of Earth starting from 10 million light years away. Then the scale
changes to a view of 1 million light years away, and
then 100,000 light years away (a factor of ten each
time). The scale continues changing until it reaches
Earth—and then continues all the way down to subatomic particles. Let it play through, and then use
the manual controls to step through the different
scales for a better view of the process.
Hands-on Application 7.1
Powers of 10 – A Demonstration of Scale