

108
Chapter 5 Working With Digital Spatial Data and GIS
How Is Non-Spatial Data Handled by GIS?
Regardless if you’re mapping schools ranked by average SAT scores or the locations of the United States’ top tourist destinations, all of this numeric data
needs to be somehow represented in the GIS. For instance (going back to the
digitizing example), if you have two data layers (one containing polygons representing housing footprints and one containing lines representing the driveways), each would contain multiple objects. The GIS will have information
The USGS has an online tool for viewing the 1992
and 2001 NLCD (and some products derived from
it), as well as letting you download sections of the
dataset for use in GIS. The viewer is available at
http://gisdata.usgs.net/website/MRLC/viewer.htm.
The default view should be the 2001 NLCD data
(although 2006 data is also available). From the
display options on the right side of the screen, you
can select different NLCD data to view. Zoom in to
your local area and examine the NCLD—what do the
various colors of the grid cells represent (in terms of
their land cover)? How are the 1992 and 2001 datasets different? If you want to download the data,
the tools in the viewer will allow you to directly
download the raster datasets.
Hands-on Application 5.4
The National Land Cover Database (NLCD)
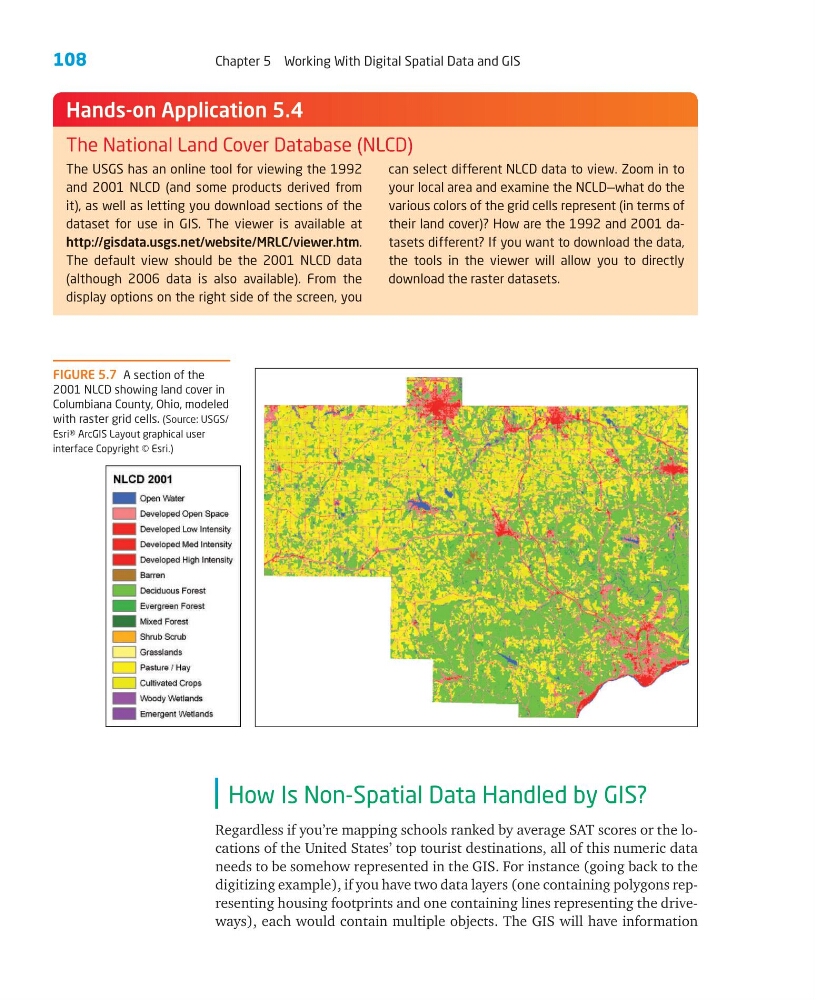
FIGURE 5.7 A section of the
2001 NLCD showing land cover in
Columbiana County, Ohio, modeled
with raster grid cells. (Source: USGS/
Esri® ArcGIS Layout graphical user
interface Copyright © Esri.)
Chapter 5 Working With Digital Spatial Data and GIS
How Is Non-Spatial Data Handled by GIS?
Regardless if you’re mapping schools ranked by average SAT scores or the locations of the United States’ top tourist destinations, all of this numeric data
needs to be somehow represented in the GIS. For instance (going back to the
digitizing example), if you have two data layers (one containing polygons representing housing footprints and one containing lines representing the driveways), each would contain multiple objects. The GIS will have information
The USGS has an online tool for viewing the 1992
and 2001 NLCD (and some products derived from
it), as well as letting you download sections of the
dataset for use in GIS. The viewer is available at
http://gisdata.usgs.net/website/MRLC/viewer.htm.
The default view should be the 2001 NLCD data
(although 2006 data is also available). From the
display options on the right side of the screen, you
can select different NLCD data to view. Zoom in to
your local area and examine the NCLD—what do the
various colors of the grid cells represent (in terms of
their land cover)? How are the 1992 and 2001 datasets different? If you want to download the data,
the tools in the viewer will allow you to directly
download the raster datasets.
Hands-on Application 5.4
The National Land Cover Database (NLCD)
FIGURE 5.7 A section of the
2001 NLCD showing land cover in
Columbiana County, Ohio, modeled
with raster grid cells. (Source: USGS/
Esri® ArcGIS Layout graphical user
interface Copyright © Esri.)