

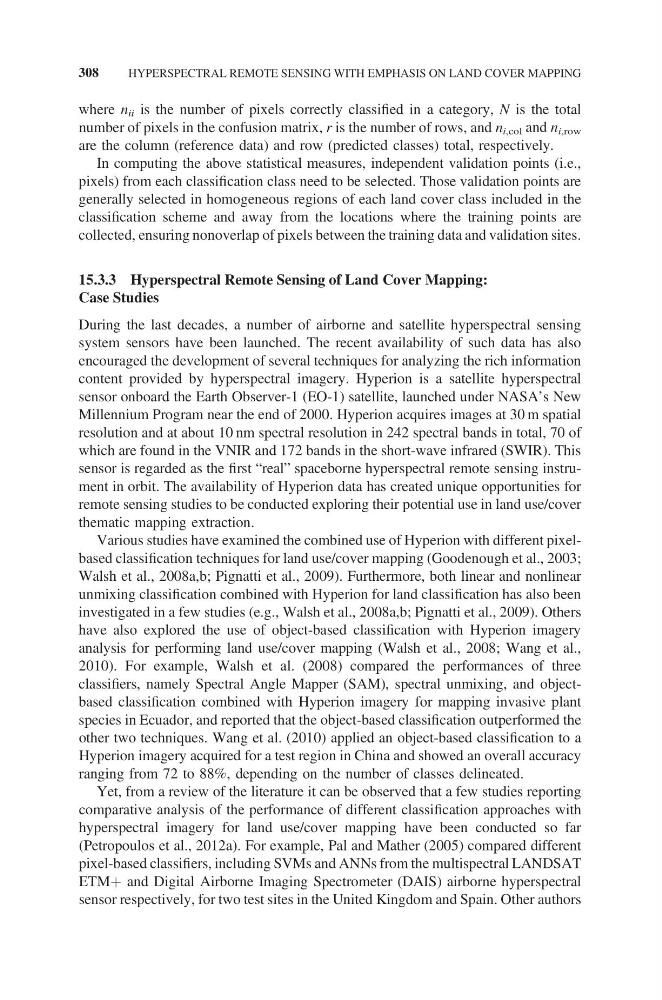
where n ii is the number of pixels correctly classified in a category, N is the total
number of pixels in the confusion matrix, r is the number of rows, and n i,col and n i,row
are the column (reference data) and row (predicted classes) total, respectively.
In computing the above statistical measures, independent validation points (i.e.,
pixels) from each classification class need to be selected. Those validation points are
generally selected in homogeneous regions of each land cover class included in the
classification scheme and away from the locations where the training points are
collected, ensuring nonoverlap of pixels between the training data and validation sites.
15.3.3 Hyperspectral Remote Sensing of Land Cover Mapping:
Case Studies
During the last decades, a number of airborne and satellite hyperspectral sensing
system sensors have been launched. The recent availability of such data has also
encouraged the development of several techniques for analyzing the rich information
content provided by hyperspectral imagery. Hyperion is a satellite hyperspectral
sensor onboard the Earth Observer-1 (EO-1) satellite, launched under NASA’s New
Millennium Program near the end of 2000. Hyperion acquires images at 30 m spatial
resolution and at about 10 nm spectral resolution in 242 spectral bands in total, 70 of
which are found in the VNIR and 172 bands in the short-wave infrared (SWIR). This
sensor is regarded as the first “real” spaceborne hyperspectral remote sensing instrument in orbit. The availability of Hyperion data has created unique opportunities for
remote sensing studies to be conducted exploring their potential use in land use/cover
thematic mapping extraction.
Various studies have examined the combined use of Hyperion with different pixelbased classification techniques for land use/cover mapping (Goodenough et al., 2003;
Walsh et al., 2008a,b; Pignatti et al., 2009). Furthermore, both linear and nonlinear
unmixing classification combined with Hyperion for land classification has also been
investigated in a few studies (e.g., Walsh et al., 2008a,b; Pignatti et al., 2009). Others
have also explored the use of object-based classification with Hyperion imagery
analysis for performing land use/cover mapping (Walsh et al., 2008; Wang et al.,
2010). For example, Walsh et al. (2008) compared the performances of three
classifiers, namely Spectral Angle Mapper (SAM), spectral unmixing, and objectbased classification combined with Hyperion imagery for mapping invasive plant
species in Ecuador, and reported that the object-based classification outperformed the
other two techniques. Wang et al. (2010) applied an object-based classification to a
Hyperion imagery acquired for a test region in China and showed an overall accuracy
ranging from 72 to 88%, depending on the number of classes delineated.
Yet, from a review of the literature it can be observed that a few studies reporting
comparative analysis of the performance of different classification approaches with
hyperspectral imagery for land use/cover mapping have been conducted so far
(Petropoulos et al., 2012a). For example, Pal and Mather (2005) compared different
pixel-based classifiers, including SVMs and ANNs from the multispectral LANDSAT
ETM+ and Digital Airborne Imaging Spectrometer (DAIS) airborne hyperspectral
sensor respectively, for two test sites in the United Kingdom and Spain. Other authors
308
HYPERSPECTRAL REMOTE SENSING WITH EMPHASIS ON LAND COVER MAPPING
number of pixels in the confusion matrix, r is the number of rows, and n i,col and n i,row
are the column (reference data) and row (predicted classes) total, respectively.
In computing the above statistical measures, independent validation points (i.e.,
pixels) from each classification class need to be selected. Those validation points are
generally selected in homogeneous regions of each land cover class included in the
classification scheme and away from the locations where the training points are
collected, ensuring nonoverlap of pixels between the training data and validation sites.
15.3.3 Hyperspectral Remote Sensing of Land Cover Mapping:
Case Studies
During the last decades, a number of airborne and satellite hyperspectral sensing
system sensors have been launched. The recent availability of such data has also
encouraged the development of several techniques for analyzing the rich information
content provided by hyperspectral imagery. Hyperion is a satellite hyperspectral
sensor onboard the Earth Observer-1 (EO-1) satellite, launched under NASA’s New
Millennium Program near the end of 2000. Hyperion acquires images at 30 m spatial
resolution and at about 10 nm spectral resolution in 242 spectral bands in total, 70 of
which are found in the VNIR and 172 bands in the short-wave infrared (SWIR). This
sensor is regarded as the first “real” spaceborne hyperspectral remote sensing instrument in orbit. The availability of Hyperion data has created unique opportunities for
remote sensing studies to be conducted exploring their potential use in land use/cover
thematic mapping extraction.
Various studies have examined the combined use of Hyperion with different pixelbased classification techniques for land use/cover mapping (Goodenough et al., 2003;
Walsh et al., 2008a,b; Pignatti et al., 2009). Furthermore, both linear and nonlinear
unmixing classification combined with Hyperion for land classification has also been
investigated in a few studies (e.g., Walsh et al., 2008a,b; Pignatti et al., 2009). Others
have also explored the use of object-based classification with Hyperion imagery
analysis for performing land use/cover mapping (Walsh et al., 2008; Wang et al.,
2010). For example, Walsh et al. (2008) compared the performances of three
classifiers, namely Spectral Angle Mapper (SAM), spectral unmixing, and objectbased classification combined with Hyperion imagery for mapping invasive plant
species in Ecuador, and reported that the object-based classification outperformed the
other two techniques. Wang et al. (2010) applied an object-based classification to a
Hyperion imagery acquired for a test region in China and showed an overall accuracy
ranging from 72 to 88%, depending on the number of classes delineated.
Yet, from a review of the literature it can be observed that a few studies reporting
comparative analysis of the performance of different classification approaches with
hyperspectral imagery for land use/cover mapping have been conducted so far
(Petropoulos et al., 2012a). For example, Pal and Mather (2005) compared different
pixel-based classifiers, including SVMs and ANNs from the multispectral LANDSAT
ETM+ and Digital Airborne Imaging Spectrometer (DAIS) airborne hyperspectral
sensor respectively, for two test sites in the United Kingdom and Spain. Other authors
308
HYPERSPECTRAL REMOTE SENSING WITH EMPHASIS ON LAND COVER MAPPING