

15.3.2.3 Spectral Unmixing This is a very different classification approach that
divides the pixel into proportions of different spectral components called end
members, and further knowledge of their proportion to the overall spectral response
of the pixel is required (Hostert et al., 2003; Okin et al., 2001; Zhang et al., 2006). In
general, the number of end members selected must be less than the number of sensor
spectral bands in order for this technique to be applied. Also, all of the end members
present in the image should be employed in order to get reliable results. The output of
spectral unmixing is one image for each end member, with pixel values between zero
and one, representing the fraction of the original image attributed to the particular end
member. Subpixel classification approaches are generally divided into linear and
nonlinear unmixing, depending on whether it is assumed that the reflectance at each
pixel of the image is a linear or a nonlinear combination of the reflectance of each
material present within the pixel (Small, 2001; Plaza et al., 2009). Hyperspectral data
are appropriate for linear mixture model since it has much more spectral bands. The
mixture model is also good for small object detection or early warning of invasive
species. A good summary of the linear mixture model and different constraints can be
found in Miao et al. (2006).
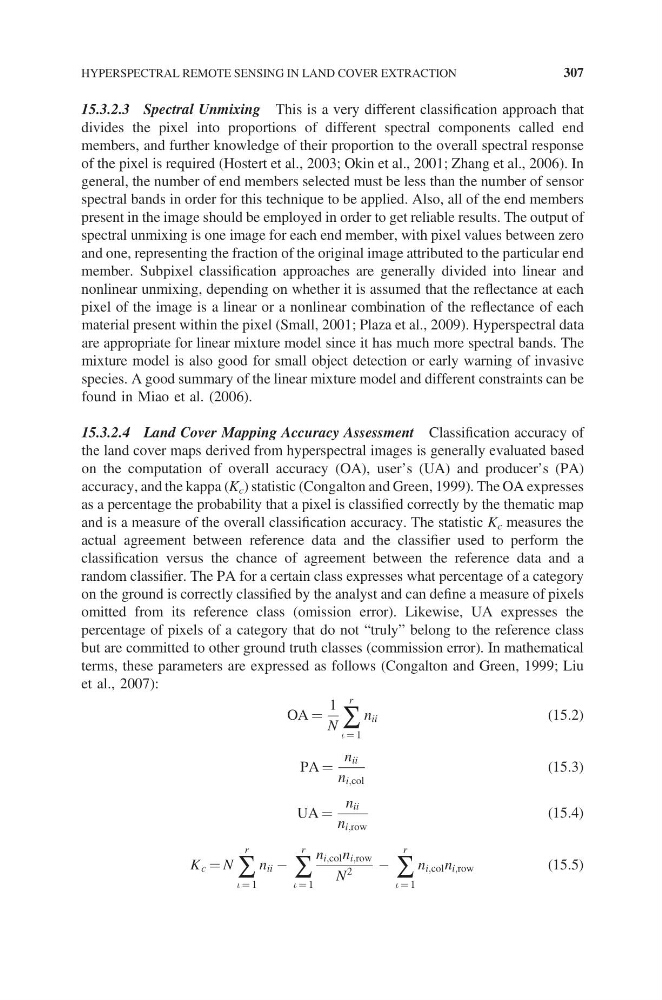
15.3.2.4 Land Cover Mapping Accuracy Assessment Classification accuracy of
the land cover maps derived from hyperspectral images is generally evaluated based
on the computation of overall accuracy (OA), user’s (UA) and producer’s (PA)
accuracy, and the kappa (K c ) statistic (Congalton and Green, 1999). The OA expresses
as a percentage the probability that a pixel is classified correctly by the thematic map
and is a measure of the overall classification accuracy. The statistic K c measures the
actual agreement between reference data and the classifier used to perform the
classification versus the chance of agreement between the reference data and a
random classifier. The PA for a certain class expresses what percentage of a category
on the ground is correctly classified by the analyst and can define a measure of pixels
omitted from its reference class (omission error). Likewise, UA expresses the
percentage of pixels of a category that do not “truly” belong to the reference class
but are committed to other ground truth classes (commission error). In mathematical
terms, these parameters are expressed as follows (Congalton and Green, 1999; Liu
et al., 2007):
OA =
1
N ∑
r
i = 1
n ii
(15.2)
PA =
n ii
n i;col
(15.3)
UA =
n ii
n i;row
(15.4)
K c = N ∑
r
i = 1
n ii − ∑
r
i = 1
n i;col n i;row
N
2
− ∑
r
i = 1
n i;col n i;row
(15.5)
HYPERSPECTRAL REMOTE SENSING IN LAND COVER EXTRACTION
307
divides the pixel into proportions of different spectral components called end
members, and further knowledge of their proportion to the overall spectral response
of the pixel is required (Hostert et al., 2003; Okin et al., 2001; Zhang et al., 2006). In
general, the number of end members selected must be less than the number of sensor
spectral bands in order for this technique to be applied. Also, all of the end members
present in the image should be employed in order to get reliable results. The output of
spectral unmixing is one image for each end member, with pixel values between zero
and one, representing the fraction of the original image attributed to the particular end
member. Subpixel classification approaches are generally divided into linear and
nonlinear unmixing, depending on whether it is assumed that the reflectance at each
pixel of the image is a linear or a nonlinear combination of the reflectance of each
material present within the pixel (Small, 2001; Plaza et al., 2009). Hyperspectral data
are appropriate for linear mixture model since it has much more spectral bands. The
mixture model is also good for small object detection or early warning of invasive
species. A good summary of the linear mixture model and different constraints can be
found in Miao et al. (2006).
15.3.2.4 Land Cover Mapping Accuracy Assessment Classification accuracy of
the land cover maps derived from hyperspectral images is generally evaluated based
on the computation of overall accuracy (OA), user’s (UA) and producer’s (PA)
accuracy, and the kappa (K c ) statistic (Congalton and Green, 1999). The OA expresses
as a percentage the probability that a pixel is classified correctly by the thematic map
and is a measure of the overall classification accuracy. The statistic K c measures the
actual agreement between reference data and the classifier used to perform the
classification versus the chance of agreement between the reference data and a
random classifier. The PA for a certain class expresses what percentage of a category
on the ground is correctly classified by the analyst and can define a measure of pixels
omitted from its reference class (omission error). Likewise, UA expresses the
percentage of pixels of a category that do not “truly” belong to the reference class
but are committed to other ground truth classes (commission error). In mathematical
terms, these parameters are expressed as follows (Congalton and Green, 1999; Liu
et al., 2007):
OA =
1
N ∑
r
i = 1
n ii
(15.2)
PA =
n ii
n i;col
(15.3)
UA =
n ii
n i;row
(15.4)
K c = N ∑
r
i = 1
n ii − ∑
r
i = 1
n i;col n i;row
N
2
− ∑
r
i = 1
n i;col n i;row
(15.5)
HYPERSPECTRAL REMOTE SENSING IN LAND COVER EXTRACTION
307