

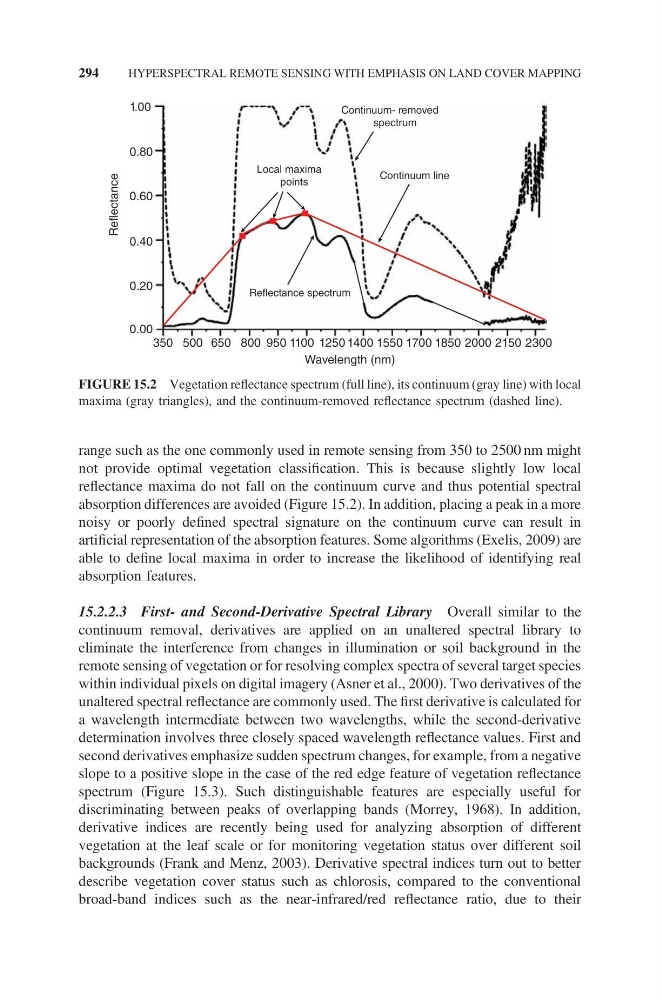
range such as the one commonly used in remote sensing from 350 to 2500 nm might
not provide optimal vegetation classification. This is because slightly low local
reflectance maxima do not fall on the continuum curve and thus potential spectral
absorption differences are avoided (Figure 15.2). In addition, placing a peak in a more
noisy or poorly defined spectral signature on the continuum curve can result in
artificial representation of the absorption features. Some algorithms (Exelis, 2009) are
able to define local maxima in order to increase the likelihood of identifying real
absorption features.
15.2.2.3 First- and Second-Derivative Spectral Library Overall similar to the
continuum removal, derivatives are applied on an unaltered spectral library to
eliminate the interference from changes in illumination or soil background in the
remote sensing of vegetation or for resolving complex spectra of several target species
within individual pixels on digital imagery (Asner et al., 2000). Two derivatives of the
unaltered spectral reflectance are commonly used. The first derivative is calculated for
a wavelength intermediate between two wavelengths, while the second-derivative
determination involves three closely spaced wavelength reflectance values. First and
second derivatives emphasize sudden spectrum changes, for example, from a negative
slope to a positive slope in the case of the red edge feature of vegetation reflectance
spectrum (Figure 15.3). Such distinguishable features are especially useful for
discriminating between peaks of overlapping bands (Morrey, 1968). In addition,
derivative indices are recently being used for analyzing absorption of different
vegetation at the leaf scale or for monitoring vegetation status over different soil
backgrounds (Frank and Menz, 2003). Derivative spectral indices turn out to better
describe vegetation cover status such as chlorosis, compared to the conventional
broad-band indices such as the near-infrared/red reflectance ratio, due to their
Wavelength (nm)
Reflectance
350 500 650 800 950 1100 1250 1400 1550 1700 1850 2000 2150 2300
Continuum- removed
spectrum
0.00
0.60
0.20
0.40
0.80
1.00
Local maxima
points
Continuum line
Reflectance spectrum
FIGURE 15.2 Vegetation reflectance spectrum (full line), its continuum (gray line) with local
maxima (gray triangles), and the continuum-removed reflectance spectrum (dashed line).
294
HYPERSPECTRAL REMOTE SENSING WITH EMPHASIS ON LAND COVER MAPPING
not provide optimal vegetation classification. This is because slightly low local
reflectance maxima do not fall on the continuum curve and thus potential spectral
absorption differences are avoided (Figure 15.2). In addition, placing a peak in a more
noisy or poorly defined spectral signature on the continuum curve can result in
artificial representation of the absorption features. Some algorithms (Exelis, 2009) are
able to define local maxima in order to increase the likelihood of identifying real
absorption features.
15.2.2.3 First- and Second-Derivative Spectral Library Overall similar to the
continuum removal, derivatives are applied on an unaltered spectral library to
eliminate the interference from changes in illumination or soil background in the
remote sensing of vegetation or for resolving complex spectra of several target species
within individual pixels on digital imagery (Asner et al., 2000). Two derivatives of the
unaltered spectral reflectance are commonly used. The first derivative is calculated for
a wavelength intermediate between two wavelengths, while the second-derivative
determination involves three closely spaced wavelength reflectance values. First and
second derivatives emphasize sudden spectrum changes, for example, from a negative
slope to a positive slope in the case of the red edge feature of vegetation reflectance
spectrum (Figure 15.3). Such distinguishable features are especially useful for
discriminating between peaks of overlapping bands (Morrey, 1968). In addition,
derivative indices are recently being used for analyzing absorption of different
vegetation at the leaf scale or for monitoring vegetation status over different soil
backgrounds (Frank and Menz, 2003). Derivative spectral indices turn out to better
describe vegetation cover status such as chlorosis, compared to the conventional
broad-band indices such as the near-infrared/red reflectance ratio, due to their
Wavelength (nm)
Reflectance
350 500 650 800 950 1100 1250 1400 1550 1700 1850 2000 2150 2300
Continuum- removed
spectrum
0.00
0.60
0.20
0.40
0.80
1.00
Local maxima
points
Continuum line
Reflectance spectrum
FIGURE 15.2 Vegetation reflectance spectrum (full line), its continuum (gray line) with local
maxima (gray triangles), and the continuum-removed reflectance spectrum (dashed line).
294
HYPERSPECTRAL REMOTE SENSING WITH EMPHASIS ON LAND COVER MAPPING