

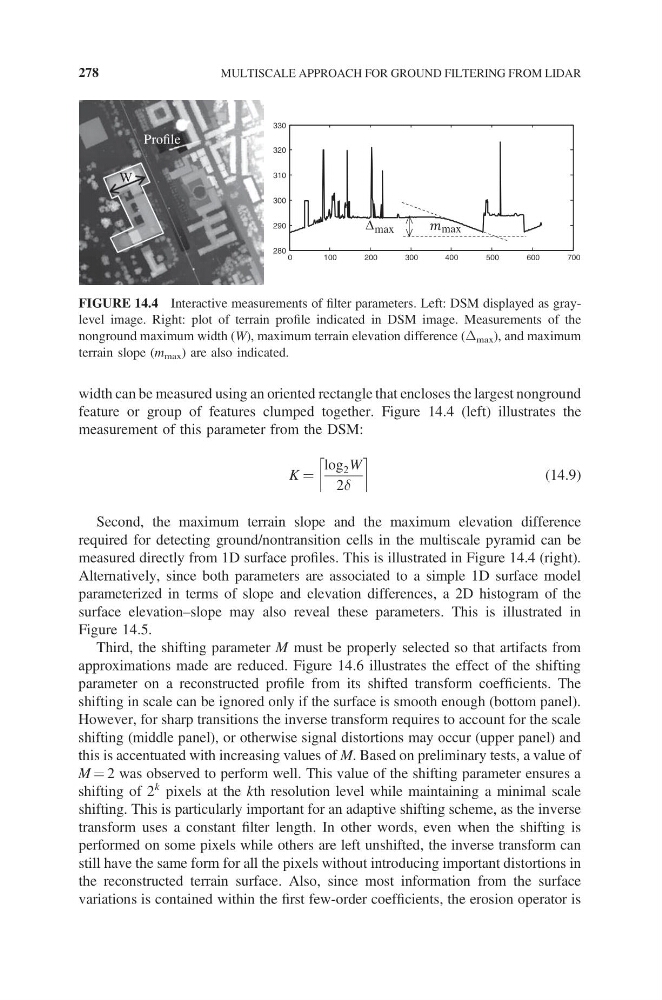
width can be measured using an oriented rectangle that encloses the largest nonground
feature or group of features clumped together. Figure 14.4 (left) illustrates the
measurement of this parameter from the DSM:
K =
log 2 W
2d
(14.9)
Second, the maximum terrain slope and the maximum elevation difference
required for detecting ground/nontransition cells in the multiscale pyramid can be
measured directly from 1D surface profiles. This is illustrated in Figure 14.4 (right).
Alternatively, since both parameters are associated to a simple 1D surface model
parameterized in terms of slope and elevation differences, a 2D histogram of the
surface elevation–slope may also reveal these parameters. This is illustrated in
Figure 14.5.
Third, the shifting parameter M must be properly selected so that artifacts from
approximations made are reduced. Figure 14.6 illustrates the effect of the shifting
parameter on a reconstructed profile from its shifted transform coefficients. The
shifting in scale can be ignored only if the surface is smooth enough (bottom panel).
However, for sharp transitions the inverse transform requires to account for the scale
shifting (middle panel), or otherwise signal distortions may occur (upper panel) and
this is accentuated with increasing values of M. Based on preliminary tests, a value of
M = 2 was observed to perform well. This value of the shifting parameter ensures a
shifting of 2
k pixels at the kth resolution level while maintaining a minimal scale
shifting. This is particularly important for an adaptive shifting scheme, as the inverse
transform uses a constant filter length. In other words, even when the shifting is
performed on some pixels while others are left unshifted, the inverse transform can
still have the same form for all the pixels without introducing important distortions in
the reconstructed terrain surface. Also, since most information from the surface
variations is contained within the first few-order coefficients, the erosion operator is
0
100
200
300
400
500
600
700
280
290
300
310
320
330
Profile
Δ
W
max
max
FIGURE 14.4 Interactive measurements of filter parameters. Left: DSM displayed as graylevel image. Right: plot of terrain profile indicated in DSM image. Measurements of the
nonground maximum width (W), maximum terrain elevation difference (D max ), and maximum
terrain slope (m max ) are also indicated.
278
MULTISCALE APPROACH FOR GROUND FILTERING FROM LIDAR
feature or group of features clumped together. Figure 14.4 (left) illustrates the
measurement of this parameter from the DSM:
K =
log 2 W
2d
(14.9)
Second, the maximum terrain slope and the maximum elevation difference
required for detecting ground/nontransition cells in the multiscale pyramid can be
measured directly from 1D surface profiles. This is illustrated in Figure 14.4 (right).
Alternatively, since both parameters are associated to a simple 1D surface model
parameterized in terms of slope and elevation differences, a 2D histogram of the
surface elevation–slope may also reveal these parameters. This is illustrated in
Figure 14.5.
Third, the shifting parameter M must be properly selected so that artifacts from
approximations made are reduced. Figure 14.6 illustrates the effect of the shifting
parameter on a reconstructed profile from its shifted transform coefficients. The
shifting in scale can be ignored only if the surface is smooth enough (bottom panel).
However, for sharp transitions the inverse transform requires to account for the scale
shifting (middle panel), or otherwise signal distortions may occur (upper panel) and
this is accentuated with increasing values of M. Based on preliminary tests, a value of
M = 2 was observed to perform well. This value of the shifting parameter ensures a
shifting of 2
k pixels at the kth resolution level while maintaining a minimal scale
shifting. This is particularly important for an adaptive shifting scheme, as the inverse
transform uses a constant filter length. In other words, even when the shifting is
performed on some pixels while others are left unshifted, the inverse transform can
still have the same form for all the pixels without introducing important distortions in
the reconstructed terrain surface. Also, since most information from the surface
variations is contained within the first few-order coefficients, the erosion operator is
0
100
200
300
400
500
600
700
280
290
300
310
320
330
Profile
Δ
W
max
max
FIGURE 14.4 Interactive measurements of filter parameters. Left: DSM displayed as graylevel image. Right: plot of terrain profile indicated in DSM image. Measurements of the
nonground maximum width (W), maximum terrain elevation difference (D max ), and maximum
terrain slope (m max ) are also indicated.
278
MULTISCALE APPROACH FOR GROUND FILTERING FROM LIDAR