

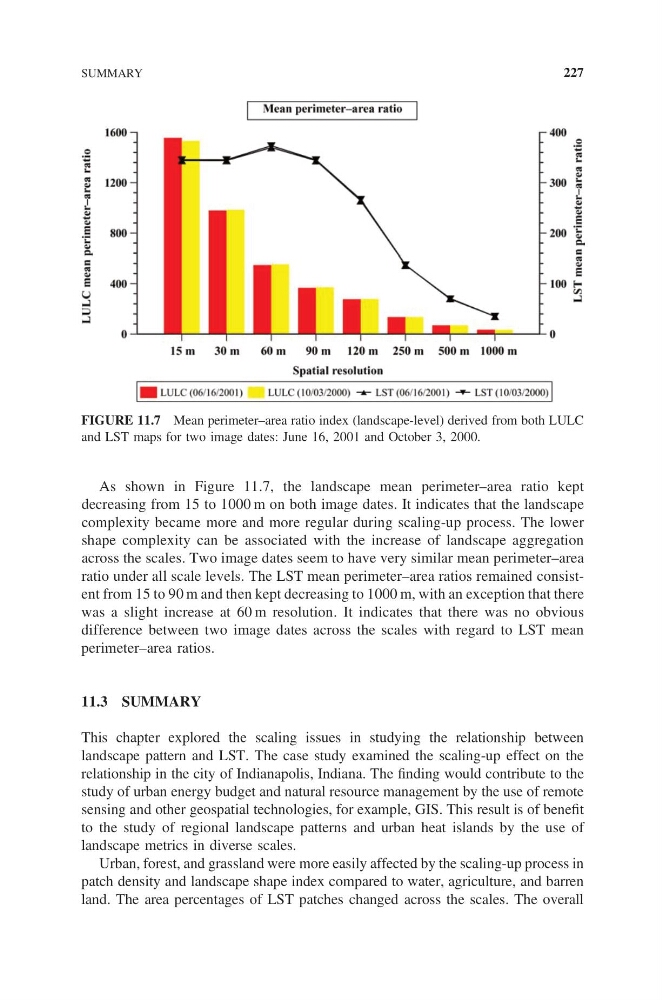
As shown in Figure 11.7, the landscape mean perimeter–area ratio kept
decreasing from 15 to 1000 m on both image dates. It indicates that the landscape
complexity became more and more regular during scaling-up process. The lower
shape complexity can be associated with the increase of landscape aggregation
across the scales. Two image dates seem to have very similar mean perimeter–area
ratio under all scale levels. The LST mean perimeter–area ratios remained consistent from 15 to 90 m and then kept decreasing to 1000 m, with an exception that there
was a slight increase at 60 m resolution. It indicates that there was no obvious
difference between two image dates across the scales with regard to LST mean
perimeter–area ratios.
11.3 SUMMARY
This chapter explored the scaling issues in studying the relationship between
landscape pattern and LST. The case study examined the scaling-up effect on the
relationship in the city of Indianapolis, Indiana. The finding would contribute to the
study of urban energy budget and natural resource management by the use of remote
sensing and other geospatial technologies, for example, GIS. This result is of benefit
to the study of regional landscape patterns and urban heat islands by the use of
landscape metrics in diverse scales.
Urban, forest, and grassland were more easily affected by the scaling-up process in
patch density and landscape shape index compared to water, agriculture, and barren
land. The area percentages of LST patches changed across the scales. The overall
FIGURE 11.7 Mean perimeter–area ratio index (landscape-level) derived from both LULC
and LST maps for two image dates: June 16, 2001 and October 3, 2000.
SUMMARY
227
decreasing from 15 to 1000 m on both image dates. It indicates that the landscape
complexity became more and more regular during scaling-up process. The lower
shape complexity can be associated with the increase of landscape aggregation
across the scales. Two image dates seem to have very similar mean perimeter–area
ratio under all scale levels. The LST mean perimeter–area ratios remained consistent from 15 to 90 m and then kept decreasing to 1000 m, with an exception that there
was a slight increase at 60 m resolution. It indicates that there was no obvious
difference between two image dates across the scales with regard to LST mean
perimeter–area ratios.
11.3 SUMMARY
This chapter explored the scaling issues in studying the relationship between
landscape pattern and LST. The case study examined the scaling-up effect on the
relationship in the city of Indianapolis, Indiana. The finding would contribute to the
study of urban energy budget and natural resource management by the use of remote
sensing and other geospatial technologies, for example, GIS. This result is of benefit
to the study of regional landscape patterns and urban heat islands by the use of
landscape metrics in diverse scales.
Urban, forest, and grassland were more easily affected by the scaling-up process in
patch density and landscape shape index compared to water, agriculture, and barren
land. The area percentages of LST patches changed across the scales. The overall
FIGURE 11.7 Mean perimeter–area ratio index (landscape-level) derived from both LULC
and LST maps for two image dates: June 16, 2001 and October 3, 2000.
SUMMARY
227