

8.3.1.2 From SS Lifetimes to Scale Domain-Level Topology The result of this
processing is a large number of ranked (blobs) polygons defined from three dimensions (x, y, t) that physically exist within the same area (x, y). As a result they visually
obscure each other when overlaid on the same study area (Figure 8.12), and querying
each polygon is not trivial. To solve this, we need an improved topology for each
ranked blob. This is achieved by considering SS events as critical thresholds within a
hyperblob, where fundamentally different geometric structures exist in both scale and
the landscape. Thus, from an ecological perspective, the lifetime of a SS blob (i.e., the
scales between two events) may be considered as a level within a specific scale
domain. And the domain can be defined by the first and last scales within a stack.
To define these levels, each hyperblob is topologically defined as a unique
multiscale entity, and its corresponding SS events are isolated (as defined in Section
8.2.2.3, Figure 8.11). Then, the location of the first SS event of each hyperblob is
geometrically defined regardless of its event type (i.e., creation, annihilation, etc.) and
at what scale it exists within the stack. Then the second, third, and nth events of
each hyperblob are isolated until the last possible event is defined. These event values
are then considered as domain-level attributes and are assigned to their corresponding
ranked blobs.
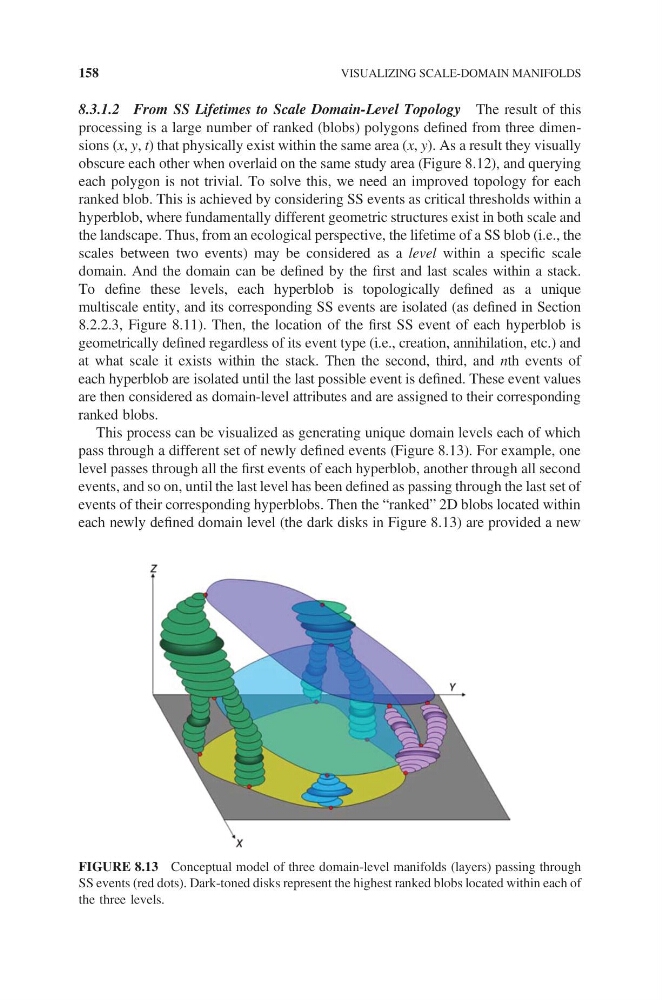
This process can be visualized as generating unique domain levels each of which
pass through a different set of newly defined events (Figure 8.13). For example, one
level passes through all the first events of each hyperblob, another through all second
events, and so on, until the last level has been defined as passing through the last set of
events of their corresponding hyperblobs. Then the “ranked” 2D blobs located within
each newly defined domain level (the dark disks in Figure 8.13) are provided a new
FIGURE 8.13 Conceptual model of three domain-level manifolds (layers) passing through
SS events (red dots). Dark-toned disks represent the highest ranked blobs located within each of
the three levels.
158
VISUALIZING SCALE-DOMAIN MANIFOLDS
processing is a large number of ranked (blobs) polygons defined from three dimensions (x, y, t) that physically exist within the same area (x, y). As a result they visually
obscure each other when overlaid on the same study area (Figure 8.12), and querying
each polygon is not trivial. To solve this, we need an improved topology for each
ranked blob. This is achieved by considering SS events as critical thresholds within a
hyperblob, where fundamentally different geometric structures exist in both scale and
the landscape. Thus, from an ecological perspective, the lifetime of a SS blob (i.e., the
scales between two events) may be considered as a level within a specific scale
domain. And the domain can be defined by the first and last scales within a stack.
To define these levels, each hyperblob is topologically defined as a unique
multiscale entity, and its corresponding SS events are isolated (as defined in Section
8.2.2.3, Figure 8.11). Then, the location of the first SS event of each hyperblob is
geometrically defined regardless of its event type (i.e., creation, annihilation, etc.) and
at what scale it exists within the stack. Then the second, third, and nth events of
each hyperblob are isolated until the last possible event is defined. These event values
are then considered as domain-level attributes and are assigned to their corresponding
ranked blobs.
This process can be visualized as generating unique domain levels each of which
pass through a different set of newly defined events (Figure 8.13). For example, one
level passes through all the first events of each hyperblob, another through all second
events, and so on, until the last level has been defined as passing through the last set of
events of their corresponding hyperblobs. Then the “ranked” 2D blobs located within
each newly defined domain level (the dark disks in Figure 8.13) are provided a new
FIGURE 8.13 Conceptual model of three domain-level manifolds (layers) passing through
SS events (red dots). Dark-toned disks represent the highest ranked blobs located within each of
the three levels.
158
VISUALIZING SCALE-DOMAIN MANIFOLDS