

The ability to define these SS events represents a critical component of SS analysis,
as scales between bifurcations are linked together forming the lifetime (Lt n ) and
topological structure of individual SS blobs (Figure 8.11). The lifetime defines the
persistence—or evolution—of a structure through scale (see Section 8.3.1.2 for a
discussion on SS lifetimes), and the topology provides a way to contextually query SS
components.
As blob behavior is strongly dependent upon image structure, it is possible that an
expected image behavior may exist (Lindeberg, 1994). Thus statistics are extracted
from a large number of stacks that describe how random noise blobs can be expected
to behave in scale space. These statistics are then used to generate a normalized (4D)
SS volume for each SS blob. In our processing we generated 100 individual stacks
resulting from 100 different random (white-noise) images the same size as the original
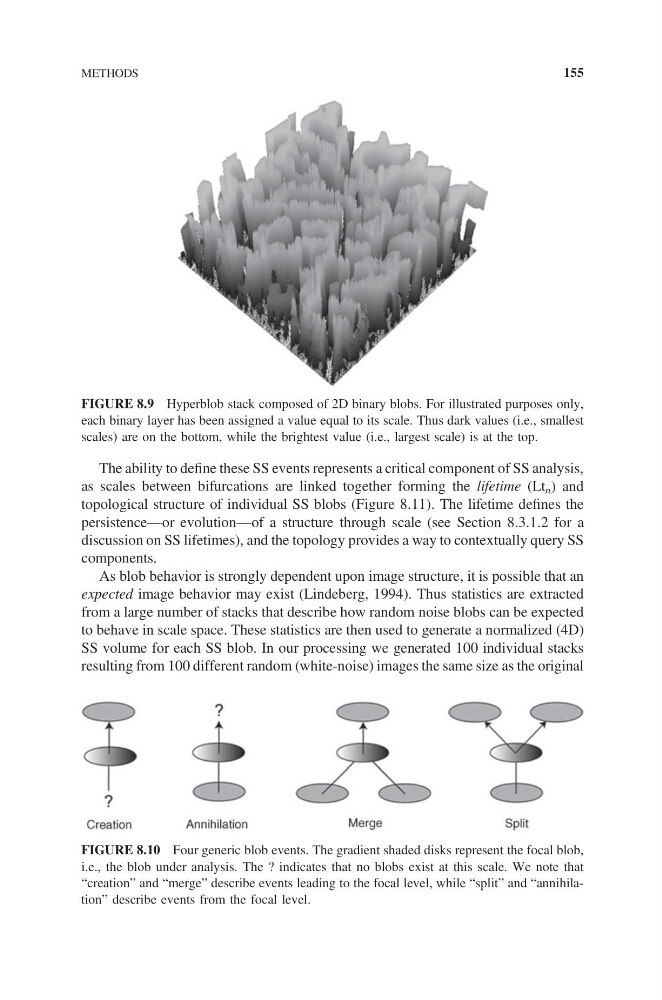
FIGURE 8.9 Hyperblob stack composed of 2D binary blobs. For illustrated purposes only,
each binary layer has been assigned a value equal to its scale. Thus dark values (i.e., smallest
scales) are on the bottom, while the brightest value (i.e., largest scale) is at the top.
FIGURE 8.10 Four generic blob events. The gradient shaded disks represent the focal blob,
i.e., the blob under analysis. The ? indicates that no blobs exist at this scale. We note that
“creation” and “merge” describe events leading to the focal level, while “split” and “annihilation” describe events from the focal level.
METHODS
155
as scales between bifurcations are linked together forming the lifetime (Lt n ) and
topological structure of individual SS blobs (Figure 8.11). The lifetime defines the
persistence—or evolution—of a structure through scale (see Section 8.3.1.2 for a
discussion on SS lifetimes), and the topology provides a way to contextually query SS
components.
As blob behavior is strongly dependent upon image structure, it is possible that an
expected image behavior may exist (Lindeberg, 1994). Thus statistics are extracted
from a large number of stacks that describe how random noise blobs can be expected
to behave in scale space. These statistics are then used to generate a normalized (4D)
SS volume for each SS blob. In our processing we generated 100 individual stacks
resulting from 100 different random (white-noise) images the same size as the original
FIGURE 8.9 Hyperblob stack composed of 2D binary blobs. For illustrated purposes only,
each binary layer has been assigned a value equal to its scale. Thus dark values (i.e., smallest
scales) are on the bottom, while the brightest value (i.e., largest scale) is at the top.
FIGURE 8.10 Four generic blob events. The gradient shaded disks represent the focal blob,
i.e., the blob under analysis. The ? indicates that no blobs exist at this scale. We note that
“creation” and “merge” describe events leading to the focal level, while “split” and “annihilation” describe events from the focal level.
METHODS
155