

subjected to two-way ANOVA (Stevens, 1996) with site and before/after defoliation
as categorical variables. Sites were defined as the six river systems for which pixels
were collected. Individual pixels represented nonoverlapping and nonadjacent sample
points within each site. Variances in pixel values within each of the six sites showed
no significant departure from normality by the Shapiro–Wilks test (p > 0.05), so they
were treated as replicated samples of ground conditions within each site.
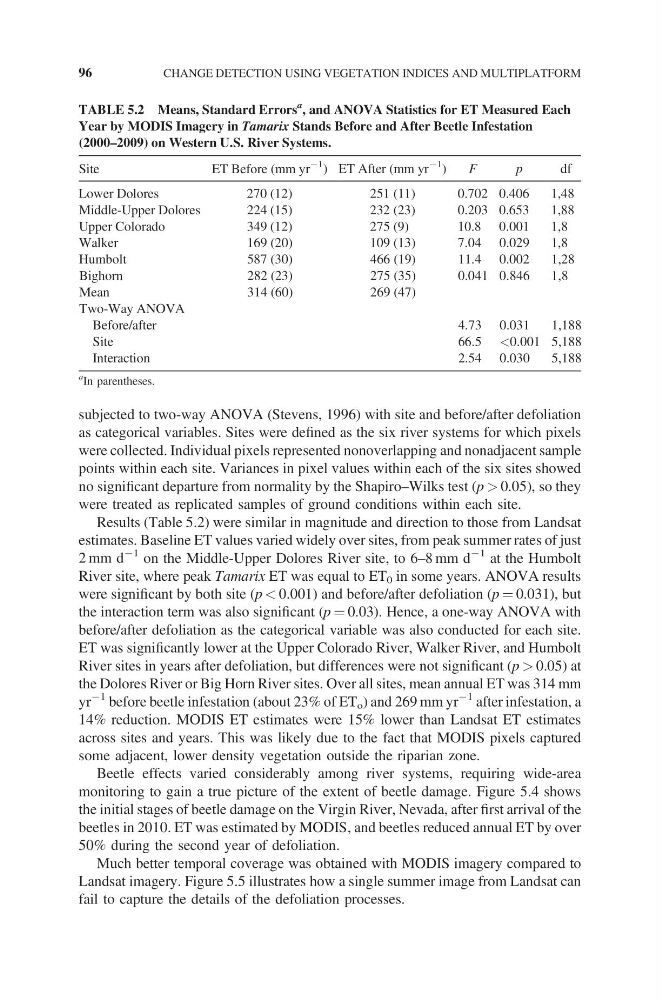
Results (Table 5.2) were similar in magnitude and direction to those from Landsat
estimates. Baseline ET values varied widely over sites, from peak summer rates of just
2 mm d
−1 on the Middle-Upper Dolores River site, to 6–8 mm d
−1 at the Humbolt
River site, where peak Tamarix ET was equal to ET 0 in some years. ANOVA results
were significant by both site (p < 0.001) and before/after defoliation (p = 0.031), but
the interaction term was also significant (p = 0.03). Hence, a one-way ANOVA with
before/after defoliation as the categorical variable was also conducted for each site.
ET was significantly lower at the Upper Colorado River, Walker River, and Humbolt
River sites in years after defoliation, but differences were not significant (p > 0.05) at
the Dolores River or Big Horn River sites. Over all sites, mean annual ET was 314 mm
yr
−1 before beetle infestation (about 23% of ET o ) and 269 mm yr
−1 after infestation, a
14% reduction. MODIS ET estimates were 15% lower than Landsat ET estimates
across sites and years. This was likely due to the fact that MODIS pixels captured
some adjacent, lower density vegetation outside the riparian zone.
Beetle effects varied considerably among river systems, requiring wide-area
monitoring to gain a true picture of the extent of beetle damage. Figure 5.4 shows
the initial stages of beetle damage on the Virgin River, Nevada, after first arrival of the
beetles in 2010. ET was estimated by MODIS, and beetles reduced annual ET by over
50% during the second year of defoliation.
Much better temporal coverage was obtained with MODIS imagery compared to
Landsat imagery. Figure 5.5 illustrates how a single summer image from Landsat can
fail to capture the details of the defoliation processes.
TABLE 5.2 Means, Standard Errors
a , and ANOVA Statistics for ET Measured Each
Year by MODIS Imagery in Tamarix Stands Before and After Beetle Infestation
(2000–2009) on Western U.S. River Systems.
Site
ET Before (mm yr
−1 ) ET After (mm yr
−1
)
F
p
df
Lower Dolores
270 (12)
251 (11)
0.702 0.406
1,48
Middle-Upper Dolores
224 (15)
232 (23)
0.203 0.653
1,88
Upper Colorado
349 (12)
275 (9)
10.8 0.001
1,8
Walker
169 (20)
109 (13)
7.04 0.029
1,8
Humbolt
587 (30)
466 (19)
11.4 0.002
1,28
Bighorn
282 (23)
275 (35)
0.041 0.846
1,8
Mean
314 (60)
269 (47)
Two-Way ANOVA
Before/after
4.73 0.031
1,188
Site
66.5 <0.001 5,188
Interaction
2.54 0.030
5,188
a
In parentheses.
96
CHANGE DETECTION USING VEGETATION INDICES AND MULTIPLATFORM
as categorical variables. Sites were defined as the six river systems for which pixels
were collected. Individual pixels represented nonoverlapping and nonadjacent sample
points within each site. Variances in pixel values within each of the six sites showed
no significant departure from normality by the Shapiro–Wilks test (p > 0.05), so they
were treated as replicated samples of ground conditions within each site.
Results (Table 5.2) were similar in magnitude and direction to those from Landsat
estimates. Baseline ET values varied widely over sites, from peak summer rates of just
2 mm d
−1 on the Middle-Upper Dolores River site, to 6–8 mm d
−1 at the Humbolt
River site, where peak Tamarix ET was equal to ET 0 in some years. ANOVA results
were significant by both site (p < 0.001) and before/after defoliation (p = 0.031), but
the interaction term was also significant (p = 0.03). Hence, a one-way ANOVA with
before/after defoliation as the categorical variable was also conducted for each site.
ET was significantly lower at the Upper Colorado River, Walker River, and Humbolt
River sites in years after defoliation, but differences were not significant (p > 0.05) at
the Dolores River or Big Horn River sites. Over all sites, mean annual ET was 314 mm
yr
−1 before beetle infestation (about 23% of ET o ) and 269 mm yr
−1 after infestation, a
14% reduction. MODIS ET estimates were 15% lower than Landsat ET estimates
across sites and years. This was likely due to the fact that MODIS pixels captured
some adjacent, lower density vegetation outside the riparian zone.
Beetle effects varied considerably among river systems, requiring wide-area
monitoring to gain a true picture of the extent of beetle damage. Figure 5.4 shows
the initial stages of beetle damage on the Virgin River, Nevada, after first arrival of the
beetles in 2010. ET was estimated by MODIS, and beetles reduced annual ET by over
50% during the second year of defoliation.
Much better temporal coverage was obtained with MODIS imagery compared to
Landsat imagery. Figure 5.5 illustrates how a single summer image from Landsat can
fail to capture the details of the defoliation processes.
TABLE 5.2 Means, Standard Errors
a , and ANOVA Statistics for ET Measured Each
Year by MODIS Imagery in Tamarix Stands Before and After Beetle Infestation
(2000–2009) on Western U.S. River Systems.
Site
ET Before (mm yr
−1 ) ET After (mm yr
−1
)
F
p
df
Lower Dolores
270 (12)
251 (11)
0.702 0.406
1,48
Middle-Upper Dolores
224 (15)
232 (23)
0.203 0.653
1,88
Upper Colorado
349 (12)
275 (9)
10.8 0.001
1,8
Walker
169 (20)
109 (13)
7.04 0.029
1,8
Humbolt
587 (30)
466 (19)
11.4 0.002
1,28
Bighorn
282 (23)
275 (35)
0.041 0.846
1,8
Mean
314 (60)
269 (47)
Two-Way ANOVA
Before/after
4.73 0.031
1,188
Site
66.5 <0.001 5,188
Interaction
2.54 0.030
5,188
a
In parentheses.
96
CHANGE DETECTION USING VEGETATION INDICES AND MULTIPLATFORM