

The distribution of diversity: challenges and applications
67
scale - dependency of range size estimates is a potentially important issue in making these assessments and
in comparing data from different regions of the world
(for further discussion of scale dependency see Box 1.2 ;
Rahbek & Graves, 2000 ; Lennon et al ., 2001 ; Whittaker
et al ., 2001; 2005 ).
As we have repeatedly emphasized in this chapter,
knowledge of the geographical distribution is fundamental in making sense of the ecological requirements,
England (Kunin, 1998 ). Extrapolating the scale/area
curves suggests that P. longifolia may be very much
more common than V. unilateralis at still fi ner scales,
although it is dangerous to attempt to infer the size and
viability of the populations of either species from such
range map data.
As range size is a key criterion in determining
whether a species should be considered endangered
(Box 4.1 ), especially where other data are lacking, the
Box 4.1 Rarity, range restriction and the Red List
Rarity is often a precursor to extinction. However, not all rare species are rare for the same reasons.
Rarity can mean that a species occurs at low densities, is adapted to a narrow range of environmental conditions, or occupies a small geographical range. These three categories (abundance,
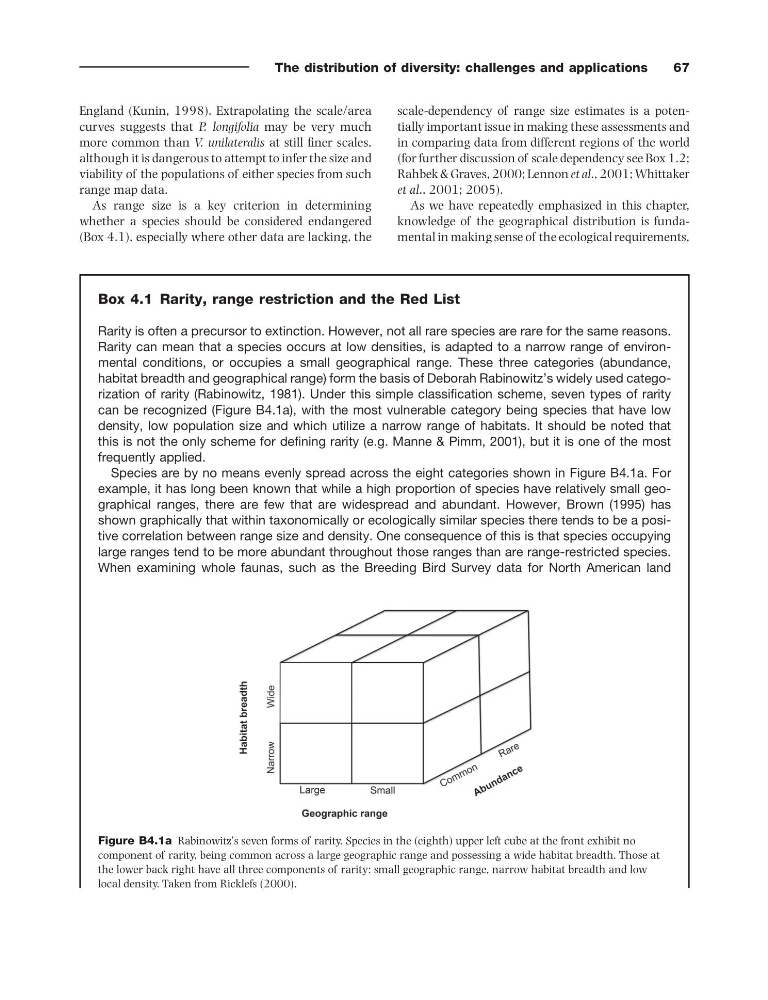
habitat breadth and geographical range) form the basis of Deborah Rabinowitz ’ s widely used categorization of rarity (Rabinowitz, 1981 ). Under this simple classifi cation scheme, seven types of rarity
can be recognized (Figure B4.1a ), with the most vulnerable category being species that have low
density, low population size and which utilize a narrow range of habitats. It should be noted that
this is not the only scheme for defi ning rarity (e.g. Manne & Pimm, 2001 ), but it is one of the most
frequently applied.
Species are by no means evenly spread across the eight categories shown in Figure B4.1a . For
example, it has long been known that while a high proportion of species have relatively small geographical ranges, there are few that are widespread and abundant. However, Brown (1995) has
shown graphically that within taxonomically or ecologically similar species there tends to be a positive correlation between range size and density. One consequence of this is that species occupying
large ranges tend to be more abundant throughout those ranges than are range - restricted species.
When examining whole faunas, such as the Breeding Bird Survey data for North American land
Figure B4.1a Rabinowitz ’ s seven forms of rarity. Species in the (eighth) upper left cube at the front exhibit no
component of rarity, being common across a large geographic range and possessing a wide habitat breadth. Those at
the lower back right have all three components of rarity: small geographic range, narrow habitat breadth and low
local density. Taken from Ricklefs (2000) .
67
scale - dependency of range size estimates is a potentially important issue in making these assessments and
in comparing data from different regions of the world
(for further discussion of scale dependency see Box 1.2 ;
Rahbek & Graves, 2000 ; Lennon et al ., 2001 ; Whittaker
et al ., 2001; 2005 ).
As we have repeatedly emphasized in this chapter,
knowledge of the geographical distribution is fundamental in making sense of the ecological requirements,
England (Kunin, 1998 ). Extrapolating the scale/area
curves suggests that P. longifolia may be very much
more common than V. unilateralis at still fi ner scales,
although it is dangerous to attempt to infer the size and
viability of the populations of either species from such
range map data.
As range size is a key criterion in determining
whether a species should be considered endangered
(Box 4.1 ), especially where other data are lacking, the
Box 4.1 Rarity, range restriction and the Red List
Rarity is often a precursor to extinction. However, not all rare species are rare for the same reasons.
Rarity can mean that a species occurs at low densities, is adapted to a narrow range of environmental conditions, or occupies a small geographical range. These three categories (abundance,
habitat breadth and geographical range) form the basis of Deborah Rabinowitz ’ s widely used categorization of rarity (Rabinowitz, 1981 ). Under this simple classifi cation scheme, seven types of rarity
can be recognized (Figure B4.1a ), with the most vulnerable category being species that have low
density, low population size and which utilize a narrow range of habitats. It should be noted that
this is not the only scheme for defi ning rarity (e.g. Manne & Pimm, 2001 ), but it is one of the most
frequently applied.
Species are by no means evenly spread across the eight categories shown in Figure B4.1a . For
example, it has long been known that while a high proportion of species have relatively small geographical ranges, there are few that are widespread and abundant. However, Brown (1995) has
shown graphically that within taxonomically or ecologically similar species there tends to be a positive correlation between range size and density. One consequence of this is that species occupying
large ranges tend to be more abundant throughout those ranges than are range - restricted species.
When examining whole faunas, such as the Breeding Bird Survey data for North American land
Figure B4.1a Rabinowitz ’ s seven forms of rarity. Species in the (eighth) upper left cube at the front exhibit no
component of rarity, being common across a large geographic range and possessing a wide habitat breadth. Those at
the lower back right have all three components of rarity: small geographic range, narrow habitat breadth and low
local density. Taken from Ricklefs (2000) .