

66
Basic biogeography: estimating biodiversity and mapping nature
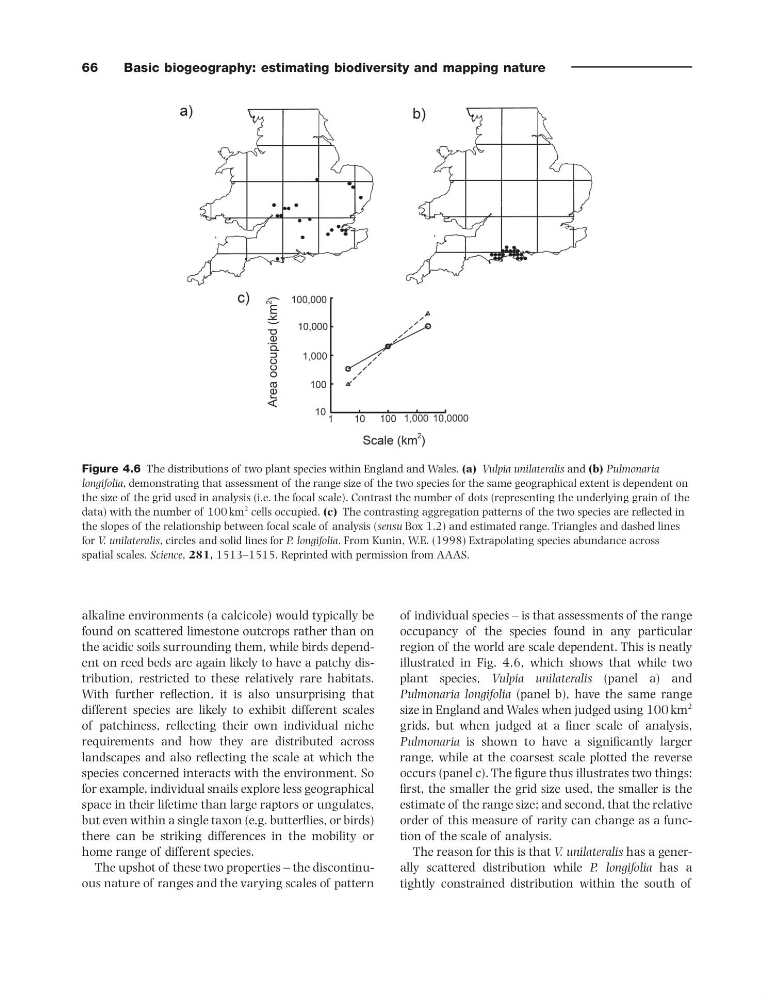
of individual species – is that assessments of the range
occupancy of the species found in any particular
region of the world are scale dependent. This is neatly
illustrated in Fig. 4.6 , which shows that while two
plant species, Vulpia unilateralis (panel a) and
Pulmonaria longifolia (panel b), have the same range
size in England and Wales when judged using 100 km
2
grids, but when judged at a fi ner scale of analysis,
Pulmonaria is shown to have a signifi cantly larger
range, while at the coarsest scale plotted the reverse
occurs (panel c). The fi gure thus illustrates two things:
fi rst, the smaller the grid size used, the smaller is the
estimate of the range size; and second, that the relative
order of this measure of rarity can change as a function of the scale of analysis.
The reason for this is that V. unilateralis has a generally scattered distribution while P. longifolia has a
tightly constrained distribution within the south of
alkaline environments (a calcicole) would typically be
found on scattered limestone outcrops rather than on
the acidic soils surrounding them, while birds dependent on reed beds are again likely to have a patchy distribution, restricted to these relatively rare habitats.
With further refl ection, it is also unsurprising that
different species are likely to exhibit different scales
of patchiness, refl ecting their own individual niche
requirements and how they are distributed across
landscapes and also refl ecting the scale at which the
species concerned interacts with the environment. So
for example, individual snails explore less geographical
space in their lifetime than large raptors or ungulates,
but even within a single taxon (e.g. butterfl ies, or birds)
there can be striking differences in the mobility or
home range of different species.
The upshot of these two properties – the discontinuous nature of ranges and the varying scales of pattern
Figure 4.6 The distributions of two plant species within England and Wales. (a) Vulpia unilateralis and (b) Pulmonaria
longifolia , demonstrating that assessment of the range size of the two species for the same geographical extent is dependent on
the size of the grid used in analysis (i.e. the focal scale). Contrast the number of dots (representing the underlying grain of the
data) with the number of 100 km
2 cells occupied. (c) The contrasting aggregation patterns of the two species are refl ected in
the slopes of the relationship between focal scale of analysis ( sensu Box 1.2 ) and estimated range. Triangles and dashed lines
for V. unilateralis , circles and solid lines for P. longifolia . From Kunin, W.E. (1998) Extrapolating species abundance across
spatial scales. Science , 281, 1513 – 1515. Reprinted with permission from AAAS.
Basic biogeography: estimating biodiversity and mapping nature
of individual species – is that assessments of the range
occupancy of the species found in any particular
region of the world are scale dependent. This is neatly
illustrated in Fig. 4.6 , which shows that while two
plant species, Vulpia unilateralis (panel a) and
Pulmonaria longifolia (panel b), have the same range
size in England and Wales when judged using 100 km
2
grids, but when judged at a fi ner scale of analysis,
Pulmonaria is shown to have a signifi cantly larger
range, while at the coarsest scale plotted the reverse
occurs (panel c). The fi gure thus illustrates two things:
fi rst, the smaller the grid size used, the smaller is the
estimate of the range size; and second, that the relative
order of this measure of rarity can change as a function of the scale of analysis.
The reason for this is that V. unilateralis has a generally scattered distribution while P. longifolia has a
tightly constrained distribution within the south of
alkaline environments (a calcicole) would typically be
found on scattered limestone outcrops rather than on
the acidic soils surrounding them, while birds dependent on reed beds are again likely to have a patchy distribution, restricted to these relatively rare habitats.
With further refl ection, it is also unsurprising that
different species are likely to exhibit different scales
of patchiness, refl ecting their own individual niche
requirements and how they are distributed across
landscapes and also refl ecting the scale at which the
species concerned interacts with the environment. So
for example, individual snails explore less geographical
space in their lifetime than large raptors or ungulates,
but even within a single taxon (e.g. butterfl ies, or birds)
there can be striking differences in the mobility or
home range of different species.
The upshot of these two properties – the discontinuous nature of ranges and the varying scales of pattern
Figure 4.6 The distributions of two plant species within England and Wales. (a) Vulpia unilateralis and (b) Pulmonaria
longifolia , demonstrating that assessment of the range size of the two species for the same geographical extent is dependent on
the size of the grid used in analysis (i.e. the focal scale). Contrast the number of dots (representing the underlying grain of the
data) with the number of 100 km
2 cells occupied. (c) The contrasting aggregation patterns of the two species are refl ected in
the slopes of the relationship between focal scale of analysis ( sensu Box 1.2 ) and estimated range. Triangles and dashed lines
for V. unilateralis , circles and solid lines for P. longifolia . From Kunin, W.E. (1998) Extrapolating species abundance across
spatial scales. Science , 281, 1513 – 1515. Reprinted with permission from AAAS.