

62
Basic biogeography: estimating biodiversity and mapping nature
4.3 THE FUNDAMENTAL TAXONOMIC
UNITS OF CONSERVATION
BIOGEOGRAPHY
As systematists and biogeographers continue to turn
to molecular approaches (Riddle et al ., 2008 ), there are
signs that reductions in Linnean and Wallacean shortfalls will not progress in parallel, for reasons that
include a lack of consensus on criteria used to diagnose
species and the utilization of units other than named
species in biogeographical and conservation analyses.
Here, we explore the conceptual and empirical consequences of using a variety of different metrics of biodiversity for the practice of doing conservation
biogeography as outlined in detail in subsequent
chapters.
4.3.1 Species v ersus o ther g enetically -
b ased c onservation u nits
No one defi nition has as yet satisfi ed all naturalists;
yet every naturalist knows vaguely what he means
when he speaks of a species.
(Darwin, 1859 , p. 101)
What are species? An answer to this seemingly straightforward question has eluded evolutionary biologists
ever since Darwin and Wallace proposed that species
are products of divergence with modifi cation from
common ancestors. The species is arguably the fundamental unit for conservation, and preventing species
that as many as 2,000 bird species may have become
extinct following human colonization of the Pacifi c
island region during the course of the late Holocene
(Steadman 1997 ), including moas, herons, swans,
geese, doves, parrots, owls, many passerines and
perhaps hundreds of species of fl ightless rails. This estimate illustrates the gulf that can exist between recorded
extinctions and what we have termed Linnean extinction estimates.
Going back a little further in time, the role of humans
in the undisputed loss of what is commonly termed the
Pleistocene mega - fauna, especially in North America
and Australia, remains a hot topic of debate (Barnosky
et al ., 2004 ; Lomolino et al ., 2010 ). It seems most likely
that a combination of environmental (principally
climatic) change, plus human activity, hunting and
altered fi re regimes, etc., were frequently involved
rather than humans being the sole cause. As regards
the present - day and future extinctions, there is again a
strong scientifi c consensus that we are entering another
phase of accelerated extinction, and some use the
phrase a ‘ sixth mass extinction spasm ’ to describe it.
The main message here, however, is that estimating
the extent of the building biodiversity crisis presents a
signifi cant challenge. An integral and crucial part of
this challenge is to identify where the threats are concentrated, which species are most at risk, and where in
the world preventative action can have greatest benefi ts for biodiversity in the various ways in which we
defi ne and value it. It is this challenge that motivates
much of the remainder of this chapter and of this book
as a whole.
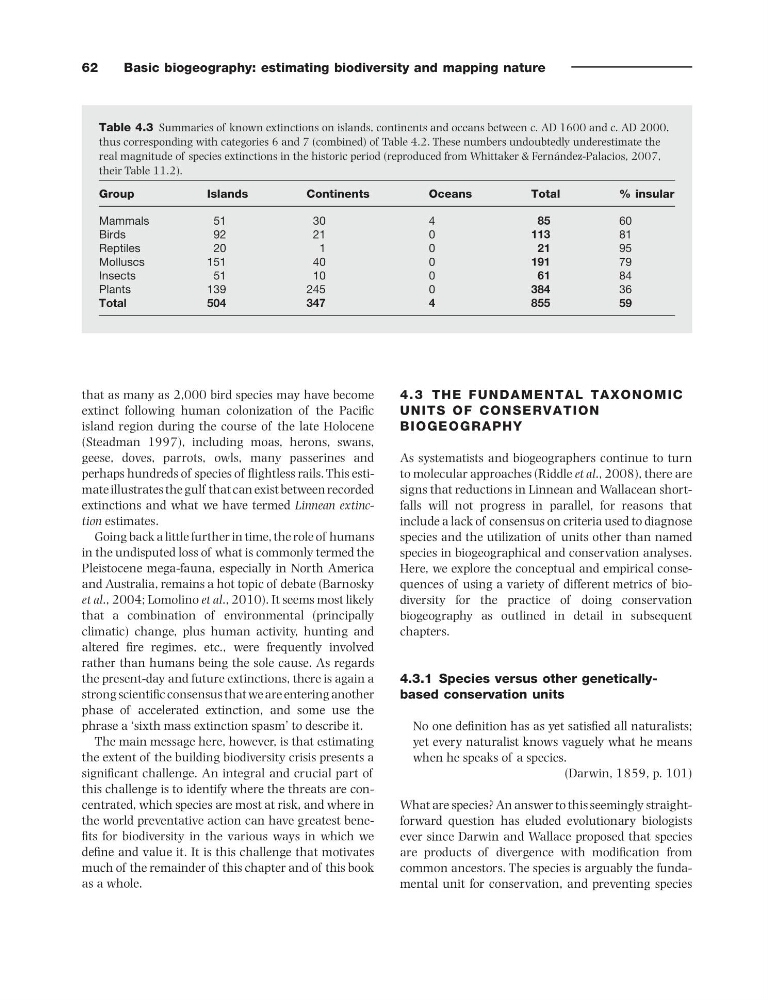
Table 4.3 Summaries of known extinctions on islands, continents and oceans between c. AD 1600 and c. AD 2000,
thus corresponding with categories 6 and 7 (combined) of Table 4.2 . These numbers undoubtedly underestimate the
real magnitude of species extinctions in the historic period (reproduced from Whittaker & Fern á ndez - Palacios, 2007 ,
their Table 11.2) .
Group
Islands
Continents
Oceans
Total
% insular
Mammals
51
30
4
85
60
Birds
92
21
0
113
81
Reptiles
20
1
0
21
95
Molluscs
151
40
0
191
79
Insects
51
10
0
61
84
Plants
139
245
0
384
36
Total
504
347
4
855
59
Basic biogeography: estimating biodiversity and mapping nature
4.3 THE FUNDAMENTAL TAXONOMIC
UNITS OF CONSERVATION
BIOGEOGRAPHY
As systematists and biogeographers continue to turn
to molecular approaches (Riddle et al ., 2008 ), there are
signs that reductions in Linnean and Wallacean shortfalls will not progress in parallel, for reasons that
include a lack of consensus on criteria used to diagnose
species and the utilization of units other than named
species in biogeographical and conservation analyses.
Here, we explore the conceptual and empirical consequences of using a variety of different metrics of biodiversity for the practice of doing conservation
biogeography as outlined in detail in subsequent
chapters.
4.3.1 Species v ersus o ther g enetically -
b ased c onservation u nits
No one defi nition has as yet satisfi ed all naturalists;
yet every naturalist knows vaguely what he means
when he speaks of a species.
(Darwin, 1859 , p. 101)
What are species? An answer to this seemingly straightforward question has eluded evolutionary biologists
ever since Darwin and Wallace proposed that species
are products of divergence with modifi cation from
common ancestors. The species is arguably the fundamental unit for conservation, and preventing species
that as many as 2,000 bird species may have become
extinct following human colonization of the Pacifi c
island region during the course of the late Holocene
(Steadman 1997 ), including moas, herons, swans,
geese, doves, parrots, owls, many passerines and
perhaps hundreds of species of fl ightless rails. This estimate illustrates the gulf that can exist between recorded
extinctions and what we have termed Linnean extinction estimates.
Going back a little further in time, the role of humans
in the undisputed loss of what is commonly termed the
Pleistocene mega - fauna, especially in North America
and Australia, remains a hot topic of debate (Barnosky
et al ., 2004 ; Lomolino et al ., 2010 ). It seems most likely
that a combination of environmental (principally
climatic) change, plus human activity, hunting and
altered fi re regimes, etc., were frequently involved
rather than humans being the sole cause. As regards
the present - day and future extinctions, there is again a
strong scientifi c consensus that we are entering another
phase of accelerated extinction, and some use the
phrase a ‘ sixth mass extinction spasm ’ to describe it.
The main message here, however, is that estimating
the extent of the building biodiversity crisis presents a
signifi cant challenge. An integral and crucial part of
this challenge is to identify where the threats are concentrated, which species are most at risk, and where in
the world preventative action can have greatest benefi ts for biodiversity in the various ways in which we
defi ne and value it. It is this challenge that motivates
much of the remainder of this chapter and of this book
as a whole.
Table 4.3 Summaries of known extinctions on islands, continents and oceans between c. AD 1600 and c. AD 2000,
thus corresponding with categories 6 and 7 (combined) of Table 4.2 . These numbers undoubtedly underestimate the
real magnitude of species extinctions in the historic period (reproduced from Whittaker & Fern á ndez - Palacios, 2007 ,
their Table 11.2) .
Group
Islands
Continents
Oceans
Total
% insular
Mammals
51
30
4
85
60
Birds
92
21
0
113
81
Reptiles
20
1
0
21
95
Molluscs
151
40
0
191
79
Insects
51
10
0
61
84
Plants
139
245
0
384
36
Total
504
347
4
855
59