

The distribution of diversity: challenges and applications
57
produced and only recently has the project shifted to
direct database entry for mapping purposes. The slow
progress of the project refl ects the large geographical
extent, covering many different countries, and the
need to collate the taxonomic information on the
species and subspecies during the process.
The signifi cance of the Linnean and Wallacean
shortfalls for conservation planning is potentially
biogeographers at the Museum of Natural History in
Helsinki, with the objective of mapping the geographical distribution of all the vascular plants in Europe, has
to date published some 13 volumes, including 3,912
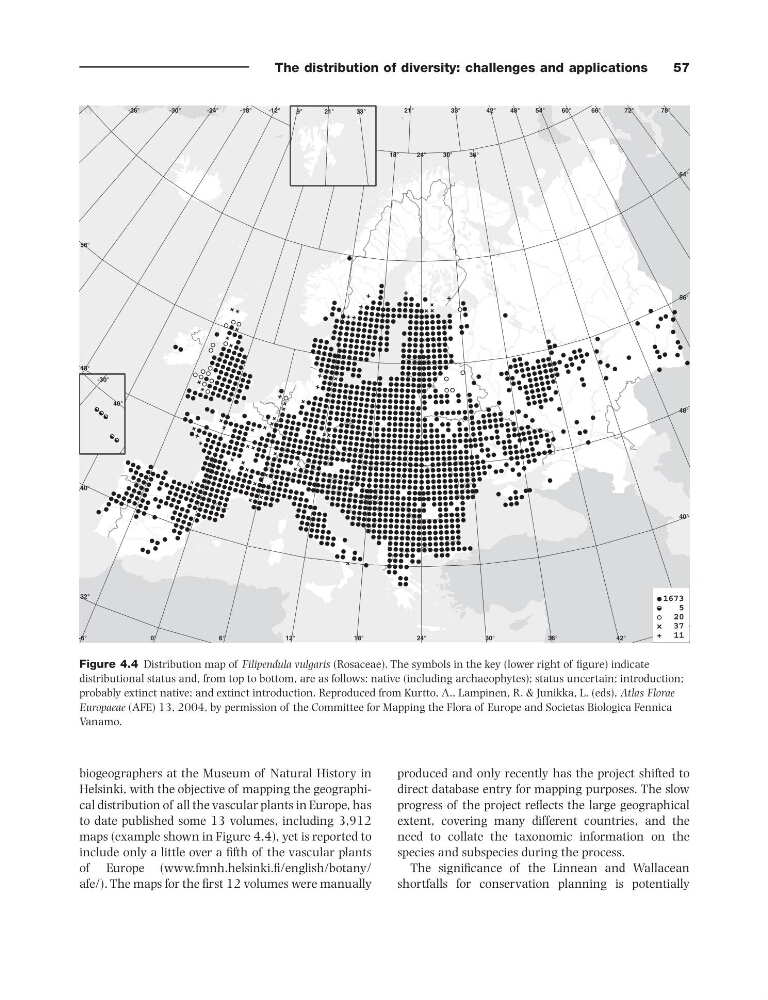
maps (example shown in Figure 4.4 ), yet is reported to
include only a little over a fi fth of the vascular plants
of Europe ( www.fmnh.helsinki.fi /english/botany/
afe/ ). The maps for the fi rst 12 volumes were manually
Figure 4.4 Distribution map of Filipendula vulgaris (Rosaceae). The symbols in the key (lower right of fi gure) indicate
distributional status and, from top to bottom, are as follows: native (including archaeophytes); status uncertain; introduction;
probably extinct native; and extinct introduction. Reproduced from Kurtto, A., Lampinen, R. & Junikka, L. (eds), Atlas Florae
Europaeae (AFE) 13, 2004, by permission of the Committee for Mapping the Flora of Europe and Societas Biologica Fennica
Vanamo.
32°
40°
48°
56°
9°
21°
33°
-30°
40°
-36°
-30°
-24°
-18°
-12°
21°
33°
42°
48°
54°
60°
66°
72°
78°
-6°
0°
6°
12°
18°
24°
30°
36°
42°
48°
40°
48°
56°
64°
18°
24°
30°
36°
11
37
20
5
1673
57
produced and only recently has the project shifted to
direct database entry for mapping purposes. The slow
progress of the project refl ects the large geographical
extent, covering many different countries, and the
need to collate the taxonomic information on the
species and subspecies during the process.
The signifi cance of the Linnean and Wallacean
shortfalls for conservation planning is potentially
biogeographers at the Museum of Natural History in
Helsinki, with the objective of mapping the geographical distribution of all the vascular plants in Europe, has
to date published some 13 volumes, including 3,912
maps (example shown in Figure 4.4 ), yet is reported to
include only a little over a fi fth of the vascular plants
of Europe ( www.fmnh.helsinki.fi /english/botany/
afe/ ). The maps for the fi rst 12 volumes were manually
Figure 4.4 Distribution map of Filipendula vulgaris (Rosaceae). The symbols in the key (lower right of fi gure) indicate
distributional status and, from top to bottom, are as follows: native (including archaeophytes); status uncertain; introduction;
probably extinct native; and extinct introduction. Reproduced from Kurtto, A., Lampinen, R. & Junikka, L. (eds), Atlas Florae
Europaeae (AFE) 13, 2004, by permission of the Committee for Mapping the Flora of Europe and Societas Biologica Fennica
Vanamo.
32°
40°
48°
56°
9°
21°
33°
-30°
40°
-36°
-30°
-24°
-18°
-12°
21°
33°
42°
48°
54°
60°
66°
72°
78°
-6°
0°
6°
12°
18°
24°
30°
36°
42°
48°
40°
48°
56°
64°
18°
24°
30°
36°
11
37
20
5
1673