

56
Basic biogeography: estimating biodiversity and mapping nature
Information on the geographical distribution of
species is not only limited by accessibility of sampling
sites, but by the particular history of plant and animal
collecting, analysis and compilation for particular
countries. Hence, much of our knowledge pertains to
political geographical units rather than ‘ natural ’ ones.
Even within comparatively wealthy countries with a
shared vision for conservation, such as those in the
European Union, there is a damaging paucity of information for many taxa.
For example, the Atlas Florae Europaeae (AFE), a
project launched in 1965 by a group of botanists and
hypothetical full distribution might be modelled from
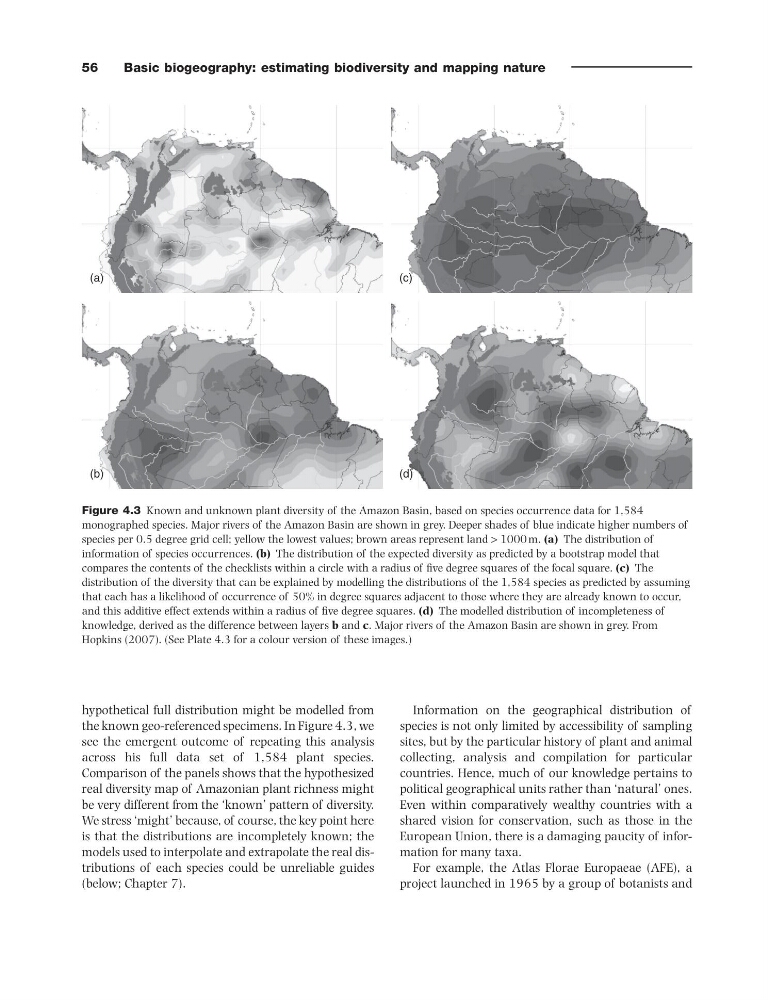
the known geo - referenced specimens. In Figure 4.3 , we
see the emergent outcome of repeating this analysis
across his full data set of 1,584 plant species.
Comparison of the panels shows that the hypothesized
real diversity map of Amazonian plant richness might
be very different from the ‘ known ’ pattern of diversity.
We stress ‘ might ’ because, of course, the key point here
is that the distributions are incompletely known; the
models used to interpolate and extrapolate the real distributions of each species could be unreliable guides
(below; Chapter 7 ).
Figure 4.3 Known and unknown plant diversity of the Amazon Basin, based on species occurrence data for 1,584
monographed species. Major rivers of the Amazon Basin are shown in grey. Deeper shades of blue indicate higher numbers of
species per 0.5 degree grid cell; yellow the lowest values; brown areas represent land > 1000 m. (a) The distribution of
information of species occurrences. (b) The distribution of the expected diversity as predicted by a bootstrap model that
compares the contents of the checklists within a circle with a radius of fi ve degree squares of the focal square. (c) The
distribution of the diversity that can be explained by modelling the distributions of the 1,584 species as predicted by assuming
that each has a likelihood of occurrence of 50% in degree squares adjacent to those where they are already known to occur,
and this additive effect extends within a radius of fi ve degree squares. (d) The modelled distribution of incompleteness of
knowledge, derived as the difference between layers b and c . Major rivers of the Amazon Basin are shown in grey. From
Hopkins (2007) . (See Plate 4.3 for a colour version of these images.)
(a)
(b)
(c)
(d)
Basic biogeography: estimating biodiversity and mapping nature
Information on the geographical distribution of
species is not only limited by accessibility of sampling
sites, but by the particular history of plant and animal
collecting, analysis and compilation for particular
countries. Hence, much of our knowledge pertains to
political geographical units rather than ‘ natural ’ ones.
Even within comparatively wealthy countries with a
shared vision for conservation, such as those in the
European Union, there is a damaging paucity of information for many taxa.
For example, the Atlas Florae Europaeae (AFE), a
project launched in 1965 by a group of botanists and
hypothetical full distribution might be modelled from
the known geo - referenced specimens. In Figure 4.3 , we
see the emergent outcome of repeating this analysis
across his full data set of 1,584 plant species.
Comparison of the panels shows that the hypothesized
real diversity map of Amazonian plant richness might
be very different from the ‘ known ’ pattern of diversity.
We stress ‘ might ’ because, of course, the key point here
is that the distributions are incompletely known; the
models used to interpolate and extrapolate the real distributions of each species could be unreliable guides
(below; Chapter 7 ).
Figure 4.3 Known and unknown plant diversity of the Amazon Basin, based on species occurrence data for 1,584
monographed species. Major rivers of the Amazon Basin are shown in grey. Deeper shades of blue indicate higher numbers of
species per 0.5 degree grid cell; yellow the lowest values; brown areas represent land > 1000 m. (a) The distribution of
information of species occurrences. (b) The distribution of the expected diversity as predicted by a bootstrap model that
compares the contents of the checklists within a circle with a radius of fi ve degree squares of the focal square. (c) The
distribution of the diversity that can be explained by modelling the distributions of the 1,584 species as predicted by assuming
that each has a likelihood of occurrence of 50% in degree squares adjacent to those where they are already known to occur,
and this additive effect extends within a radius of fi ve degree squares. (d) The modelled distribution of incompleteness of
knowledge, derived as the difference between layers b and c . Major rivers of the Amazon Basin are shown in grey. From
Hopkins (2007) . (See Plate 4.3 for a colour version of these images.)
(a)
(b)
(c)
(d)